Guide to the current developer/review preview. See the changelog for the latest changes. SystemChart remains Coming Soon on Steam; Pro DLC is not publicly available yet. Current feature images use the actual app with illustrative readings; older captures are identified in their captions. Last reviewed October 4, 2026.
12 articles
No articles match that search. Try a hardware name or a shorter phrase.
01
Start here
SystemChart brings hardware, application and game performance into a visual history on your PC. Start recording, let a workload run, then explore the detail. History begins when capture starts.
Open SystemChart from Steam when your build is available. The public page currently offers wishlisting, not an installer.
Choose whether to start capture when you sign in. You can open the charts immediately.
Leave capture running through an ordinary game or workload. Thirty minutes gives you a useful first interval. A few hours gives you more context.
Begin with Hardware overview. Open CPU, GPU, Memory or another built-in page for detail.
The default workspace includes Drivers, Black Box, System Rating and read-only SQL Workbench, with Trading third after Hardware overview and System overview; Pro adds Reports after Black Box. Existing layouts and deliberate closures are preserved. Trading records remain readable in Free; activation and new simulation activity require Pro.
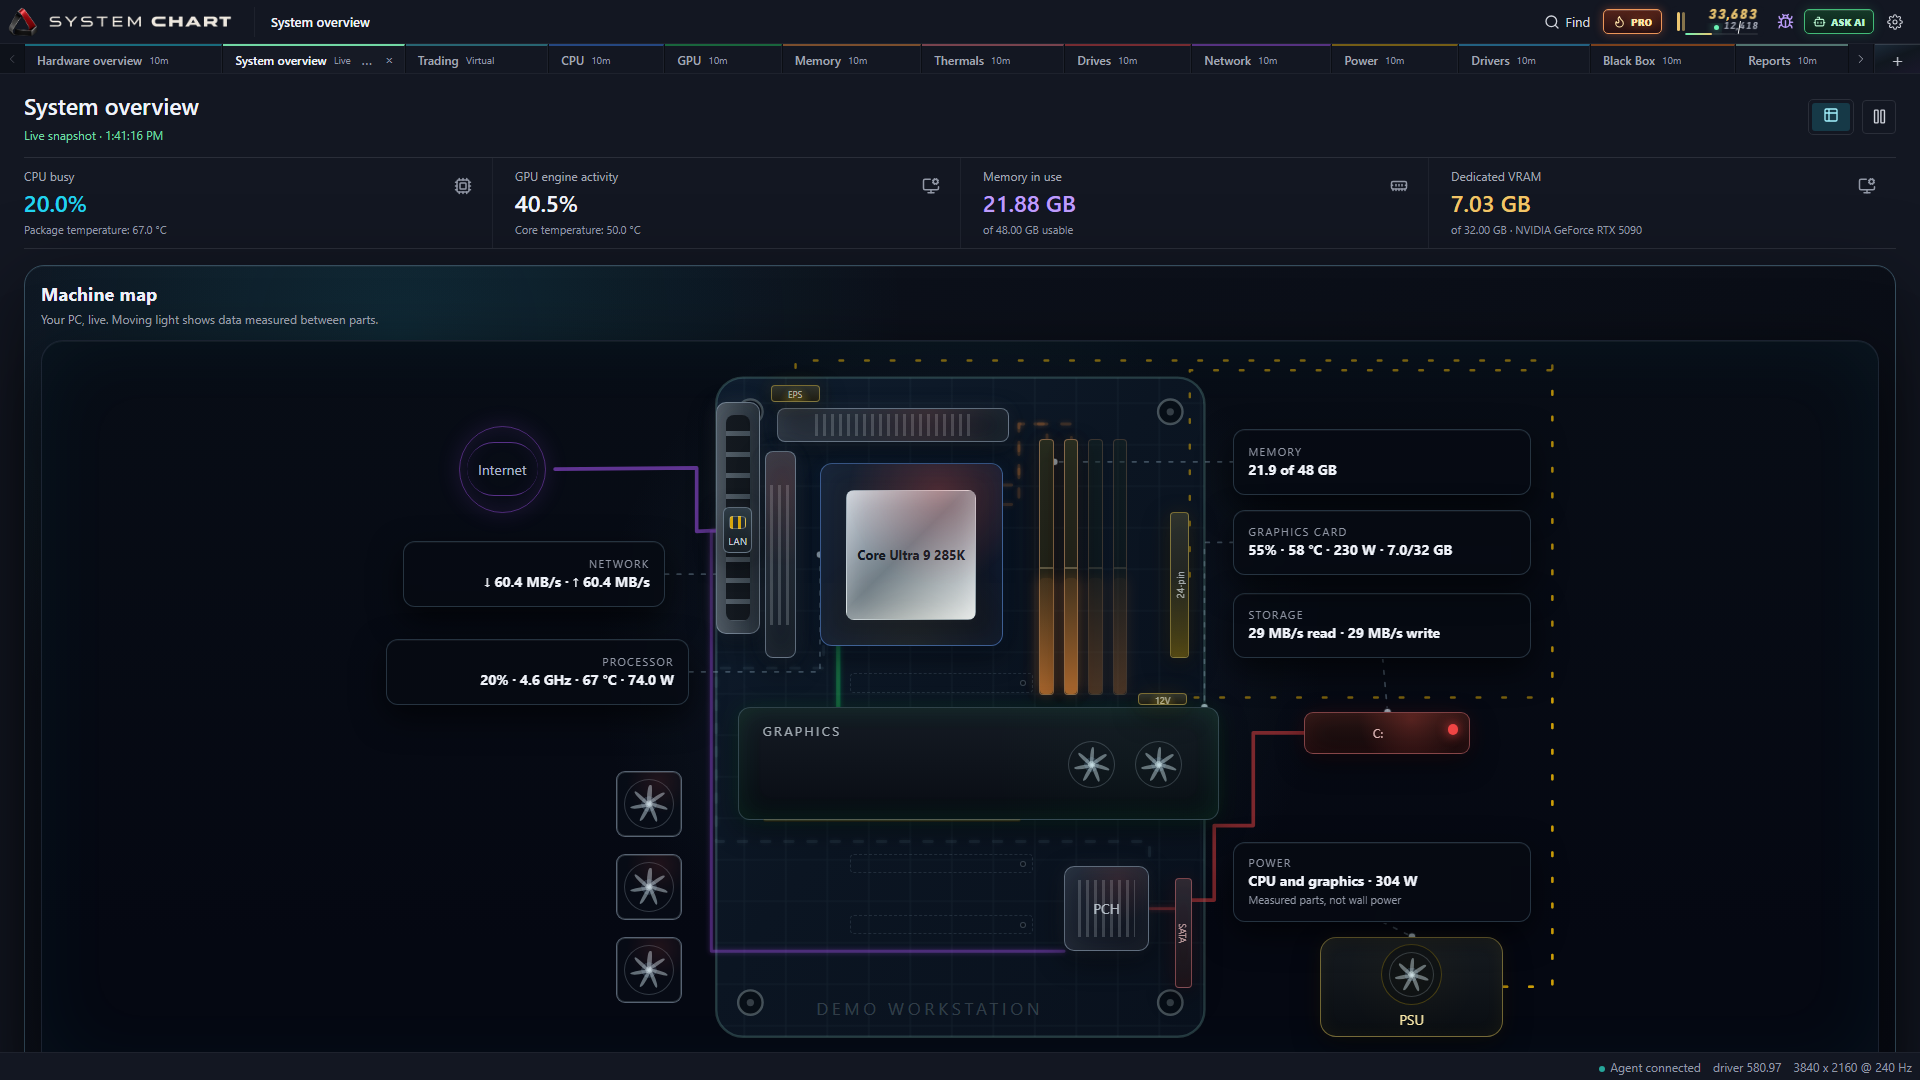
System overview opens on a machine map with live readings for the processor, graphics, memory, drives and network. CPU and GPU die views show reported activity; they are diagrams, not physical heat measurements. Expand the hardware groups, resource flows or process table for detail. GPU memory is not GPU engine utilization. A saved table-first choice still wins.
Live process snapshots are separate from retained app history. Sensor minimum, maximum and average values cover observations since the page opened or was reset, not complete capture history. Unsupported or stale readings stay explicit.
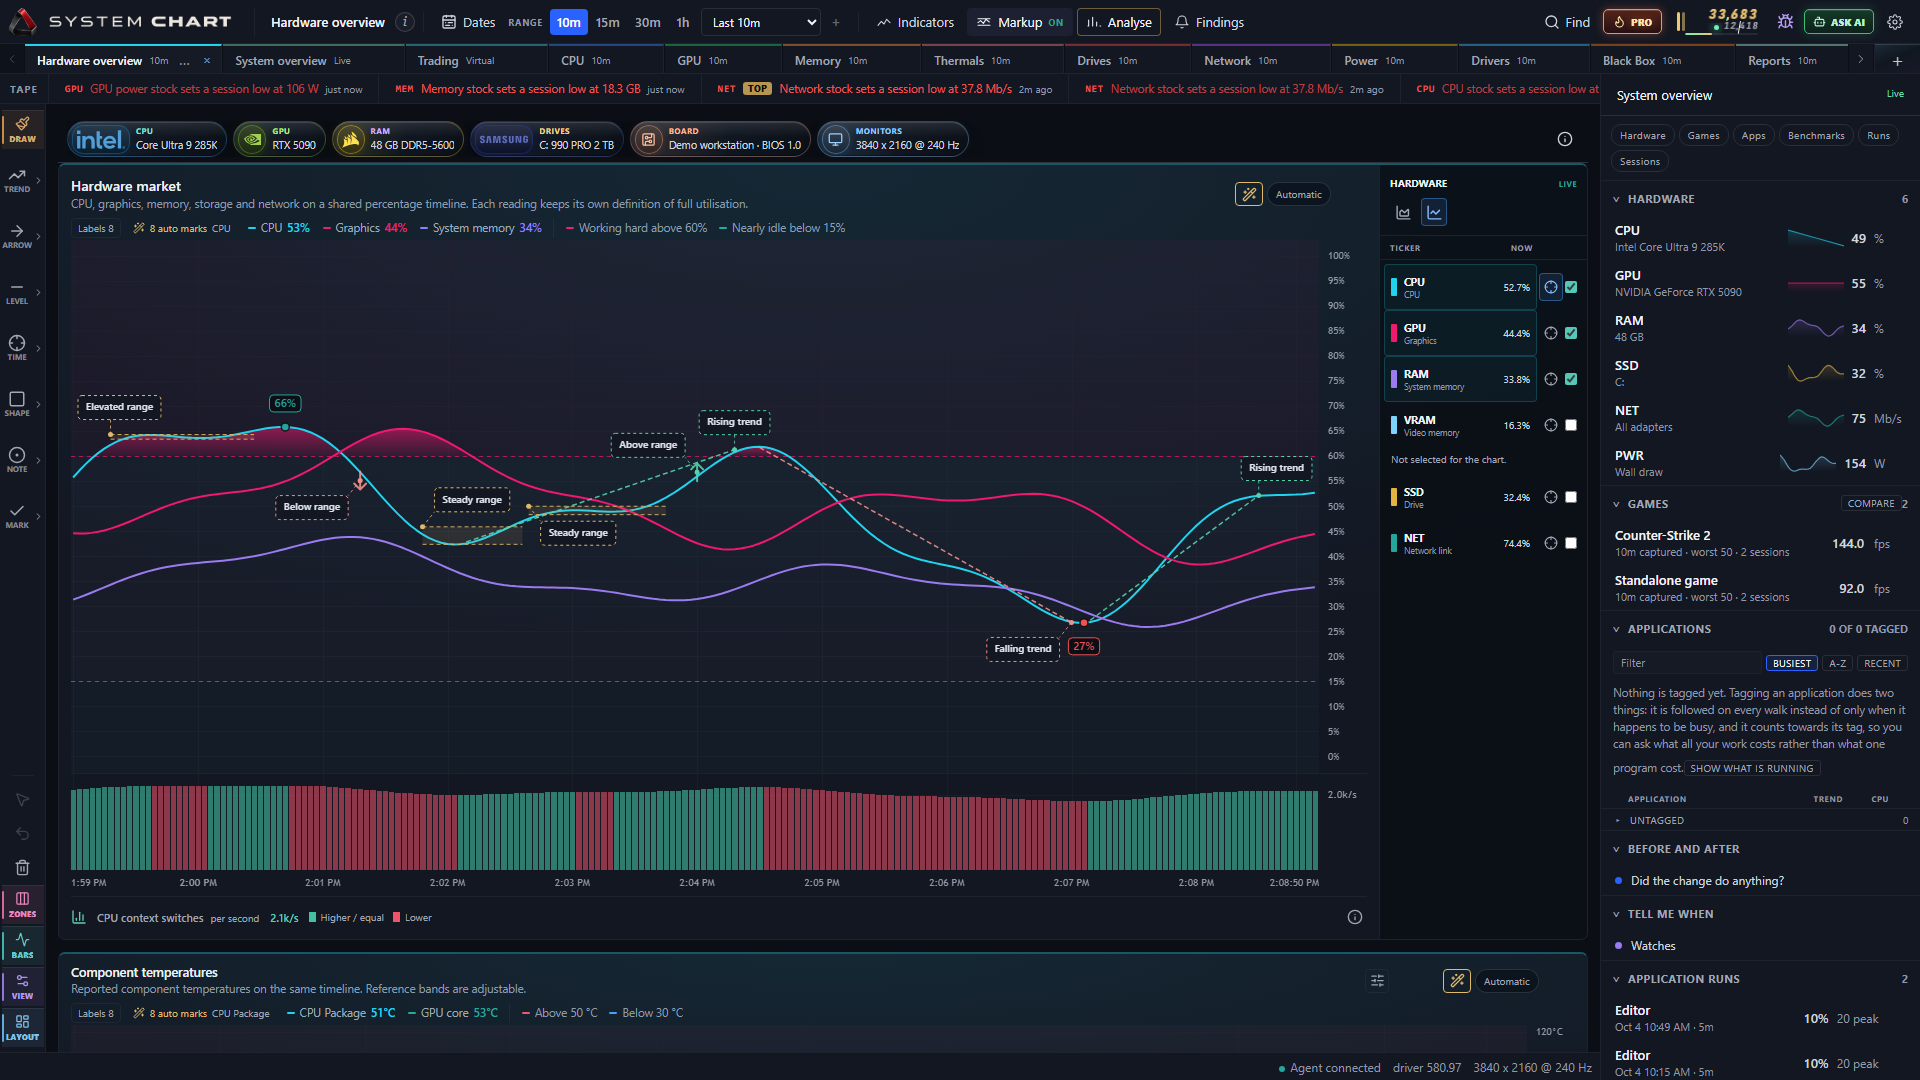
Hardware overview is Free. Actual app interface with illustrative readings; Pro edition shown.System overview is Free. Actual app interface with illustrative readings; sensor support depends on hardware.
02
Capture and history
The native recorder captures at one-second intervals during activity and eases to five seconds while idle. Frame timing is collected separately as a game presents frames.
Open Capture to check whether capture is running, paused or unavailable.
Use its pause control when you want to stop adding readings. Paused capture still lets you read existing history.
Check the retained start time before selecting an old interval. Missing time cannot be filled in later.
Review Settings, History for your edition's history window and the storage budget.
Free has a 60-day history window. Pro removes that edition time limit, within the storage budget. Losing Pro does not itself delete older readings.
Capture separates live recorder status from recorded coverage. It now opens on an activity timeline with range chips, recording density, game sessions, Black Box incidents and a live playhead. Failed refreshes keep the last successful evidence visibly stale and say what could not be read.
How much disk space does capture use?
SystemChart stores captured readings locally and packs repeated structure to reduce disk work. Growth depends on your hardware, available sensors, application and game activity, and capture cadence. Settings shows your own history and disk budget.
In the 0.9.46 storage benchmark on the development PC, data written per recording tick fell 92.7%, from 1,007.6 KiB to 74.0 KiB, with 96% fewer write operations and 83% less store CPU per tick. On the tested five-week, 645 MB history, the applications list went from 305 ms to 21 ms and ten minutes of CPU history from about 100 ms to under 1 ms. These are measurements of that workload, not a disk-growth or response-time guarantee.
Closing the Steam chart window leaves capture running. Quitting the recorder or shutting down Windows stops capture. Retention follows the edition window and storage budget.
03
Black Box
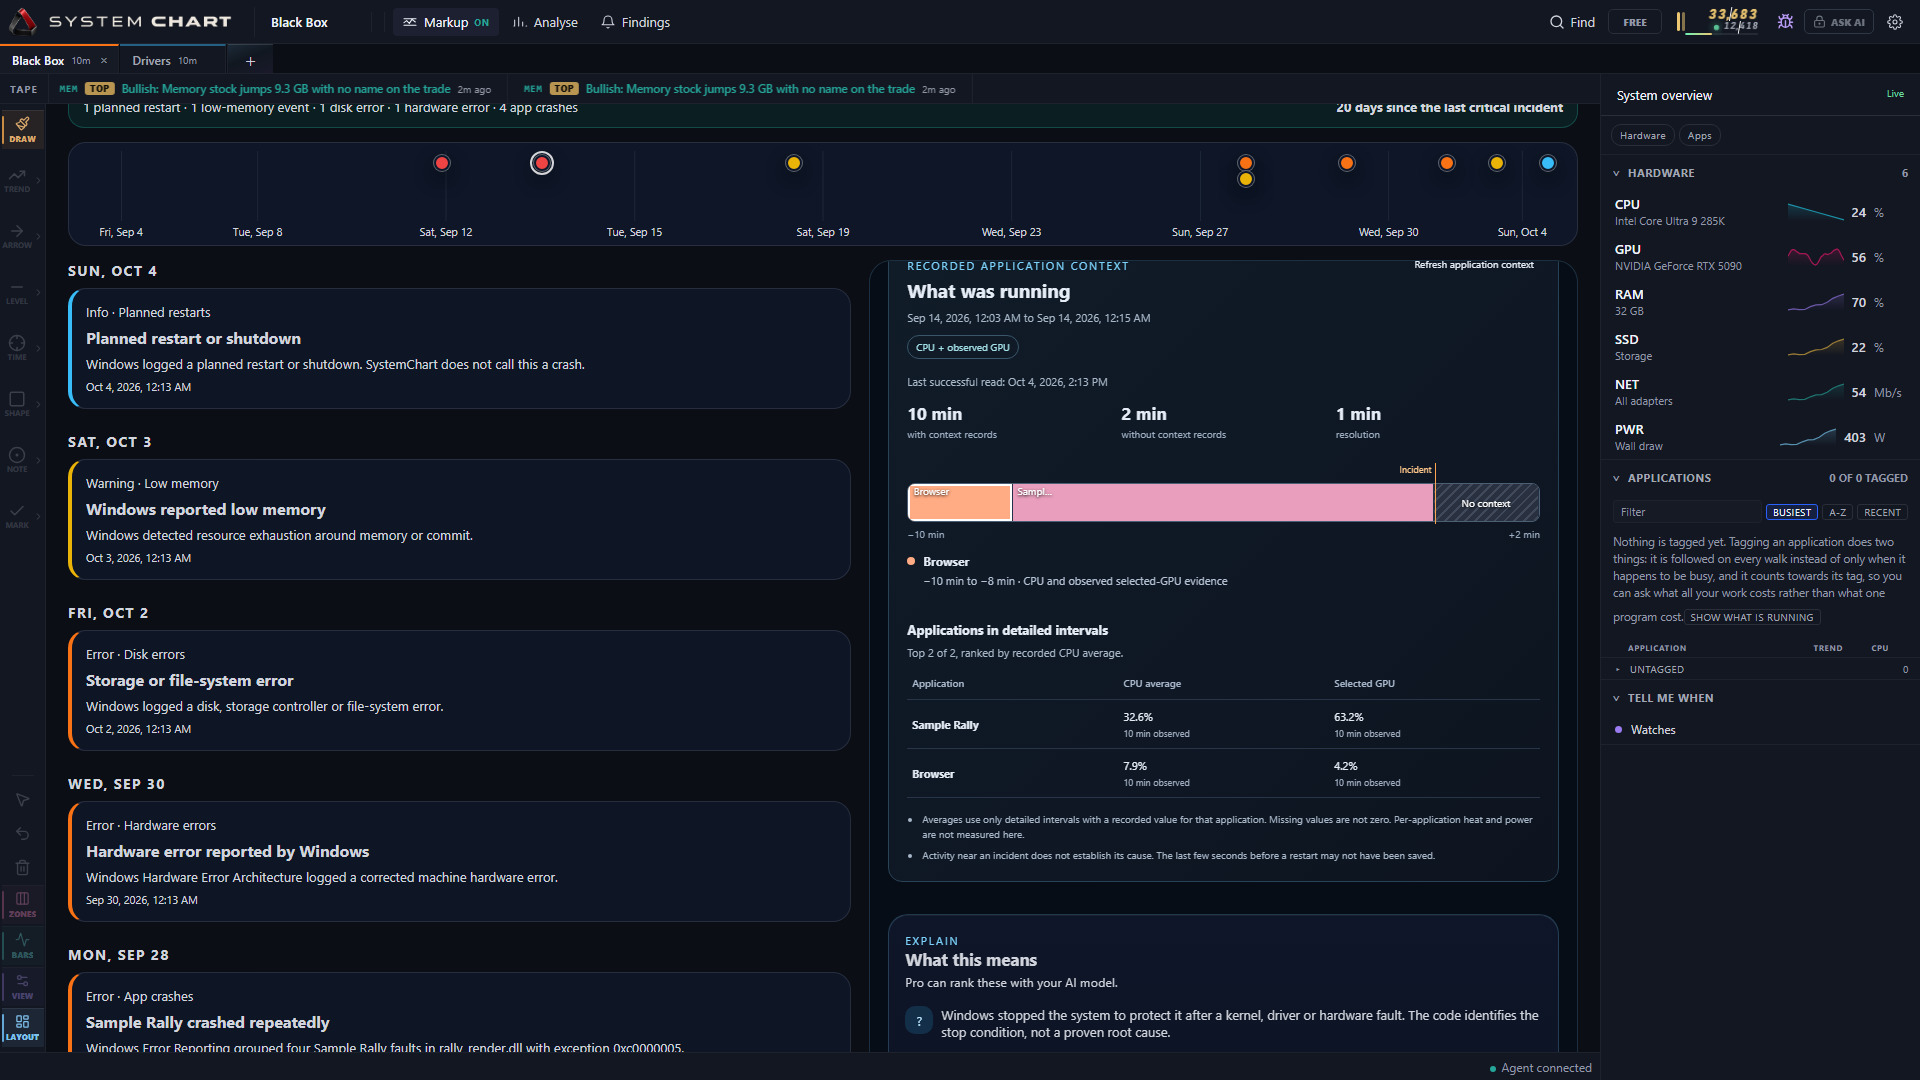
Black Box is a default Free tab. It turns selected Windows System and Application log entries into local incidents and places them beside readings SystemChart recorded in the minutes before.
Open Black Box after capture has been running.
Review unexpected restarts, stop errors, GPU driver resets, hardware errors, app crashes and hangs, low-memory warnings and disk or file-system errors.
Open an incident to see the nearby readings. Save a local HTML incident report if you need to keep or share it.
On Pro, ask the connected assistant to help diagnose an incident from the captured readings and sanitized summary.
Black Box never reads the Security log. It lists only events after recording started, says separately when a log cannot be read, strips computer and account names from restart events, and does not claim an event caused a reading.
Black Box, Free edition. Illustrative incident and application readings, with explicit gaps and causal limits.
04
Scheduled Reports
Reports are a Pro feature that creates self-contained local HTML health reports. Weekly reports run Mondays at 09:00 and monthly reports run on the 1st at 09:00, covering the previous week or month.
Open Reports to preview saved reports and schedule state.
Turn weekly or monthly reports on or off, or manually generate the latest complete period.
Open a saved report from the Reports tab. It remains readable without Pro.
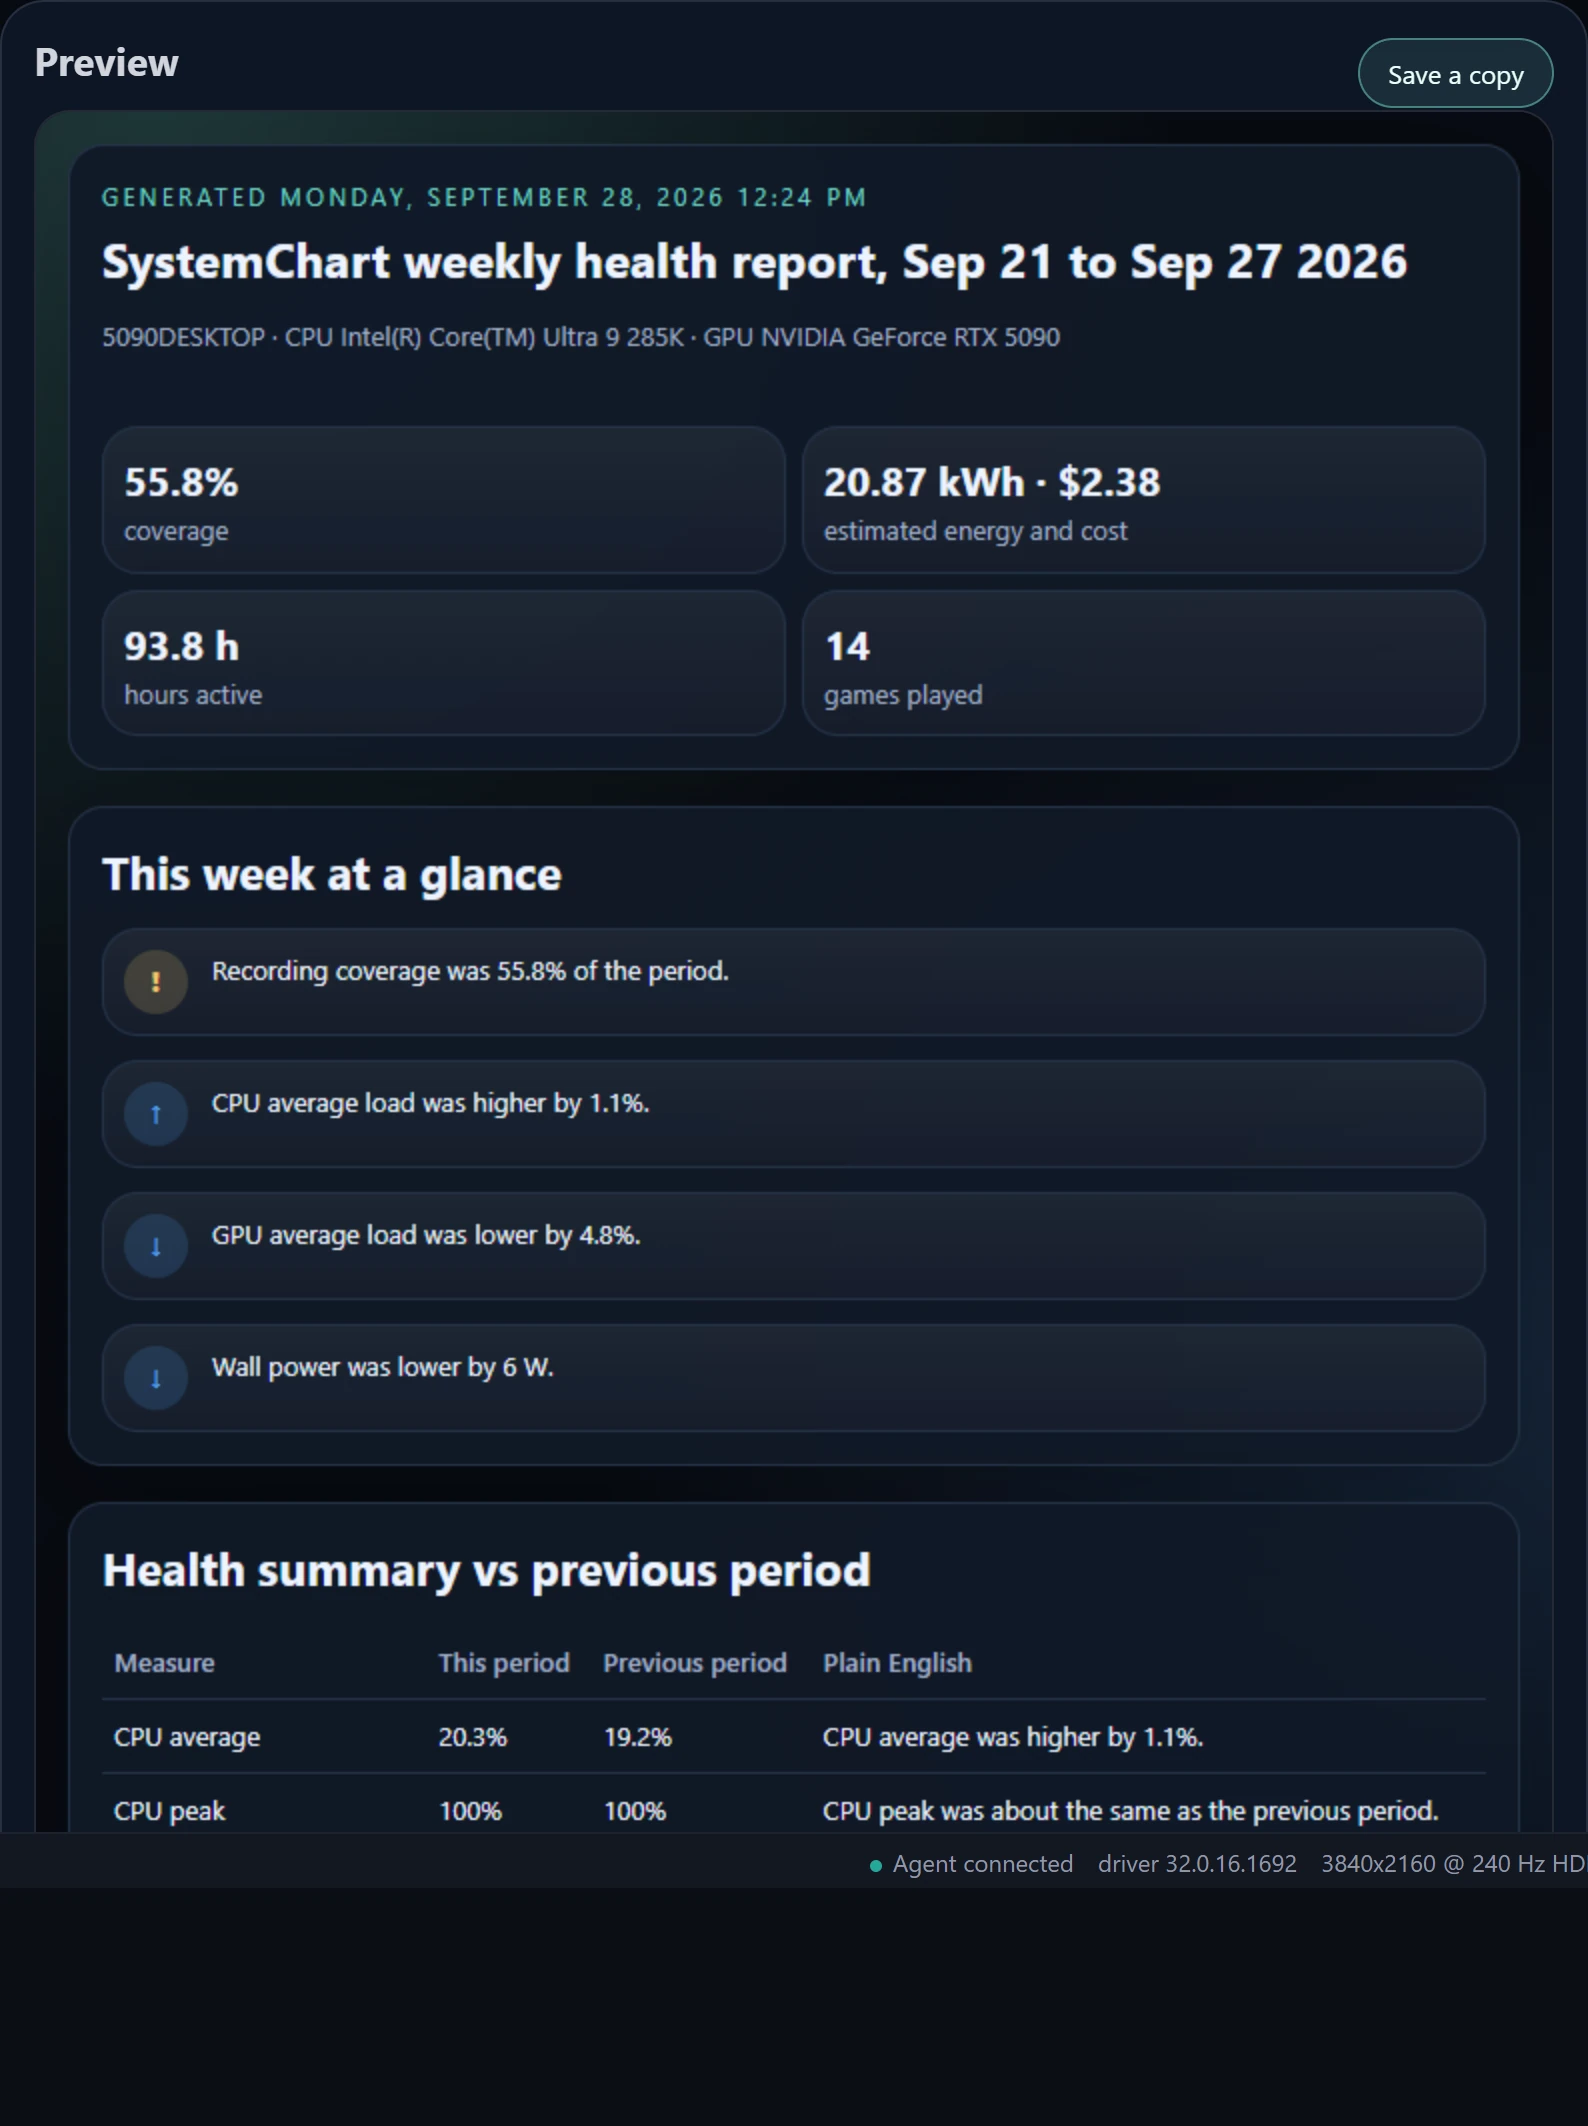
Reports are saved beside the recorder history and are never uploaded by the schedule. They include coverage, health deltas, applications, games and FPS tiers, Black Box stability, hardware and driver changes and recording gaps. If the PC was asleep or off at the scheduled time, the agent catches up once on the next start.
Free can open Reports and see a clearly marked sample preview. Creating reports and writing report settings require Pro.
A Pro weekly report from the developer's recorded history. Saved reports stay local and readable in either edition.
05
Read the charts
Move between the shape of a workload and the individual readings behind it. Time ranges, sensor selection and chart views let you examine the same history from different perspectives.
Choose a range such as 10m or 1h. Use Dates for an exact interval.
Select the CPU, GPU, RAM or other lines you want to see. Each keeps its own units and meaning.
Hover to inspect a captured value and timestamp. Click a line or its legend to hold that signal.
Use the chart controls to select reported sensors and available views. Automatic markup is separate from saved manual drawings.
Open Findings to inspect the evidence behind a change.
Gaps mean no reading was captured. A zero means a reading was captured with the value zero. Closing gaps changes their visual spacing, not the underlying timestamps.
CPU busy time and Task Manager's processor utility measure different things. Utility also reflects performance relative to the base clock.
Custom app and game names
Right-click an application or game in the right sidebar and choose Rename, or focus its row and press Shift+F10. Enter a recognizable name and choose Save name. Custom names are available in Free and Pro; recorded history stays together. To remove a custom name, open the same menu and choose Reset to original name.
Shared application context
Enable Application activity in Chart view to show one solid-color timeline across time charts. A band's application identity is shared by CPU, GPU, RAM and power charts; it does not claim that application caused the temperature, power or other reading. Memory allocation is not activity.
CPU-only, coarse and unverified GPU evidence stay labelled. A coarse bucket cannot establish one application throughout it, and low CPU with unknown GPU activity is not proof of idle. Optional new context is bounded by its own cap within the existing storage policy. Older history never gains invented GPU attribution.
Markup labels keep their exact measurement anchors. Displaced labels have leaders; selected work gets priority and labels that do not fit remain inspectable. Automatic markup and Findings remain Free; creating manual annotations or notes requires Pro.
Enthusiast Findings
The candidate's Findings shortlist explains thermal changes, background demand and resource pressure with captured values, reference intervals and evidence limits. Keep a finding to retain its evidence; an observation is not a diagnosis or proof of a cause. Recorder failures preserve the last successful findings instead of reporting an empty result.
Game performance snapshot
Each game page opens on the latest completed captured session. Choose an older session, Live or Custom range explicitly. Saved choices survive reload; an empty Live interval stays empty. Steam and non-Steam games are supported in Free.
The summary uses total captured frames divided by captured duration for average FPS, then grades it with the frame counter's seven tiers from Struggling to Machine God. Typical resolution is shown when known. Hover 1% low, 0.1% low or stutter to see what each number means.
The snapshot shows its session count and dates independently of the chart range. Up to the latest 1,000 sessions are checked, with a notice when older sessions may be excluded. Missing readings remain unavailable. Sessions may have different hardware, settings and workloads.
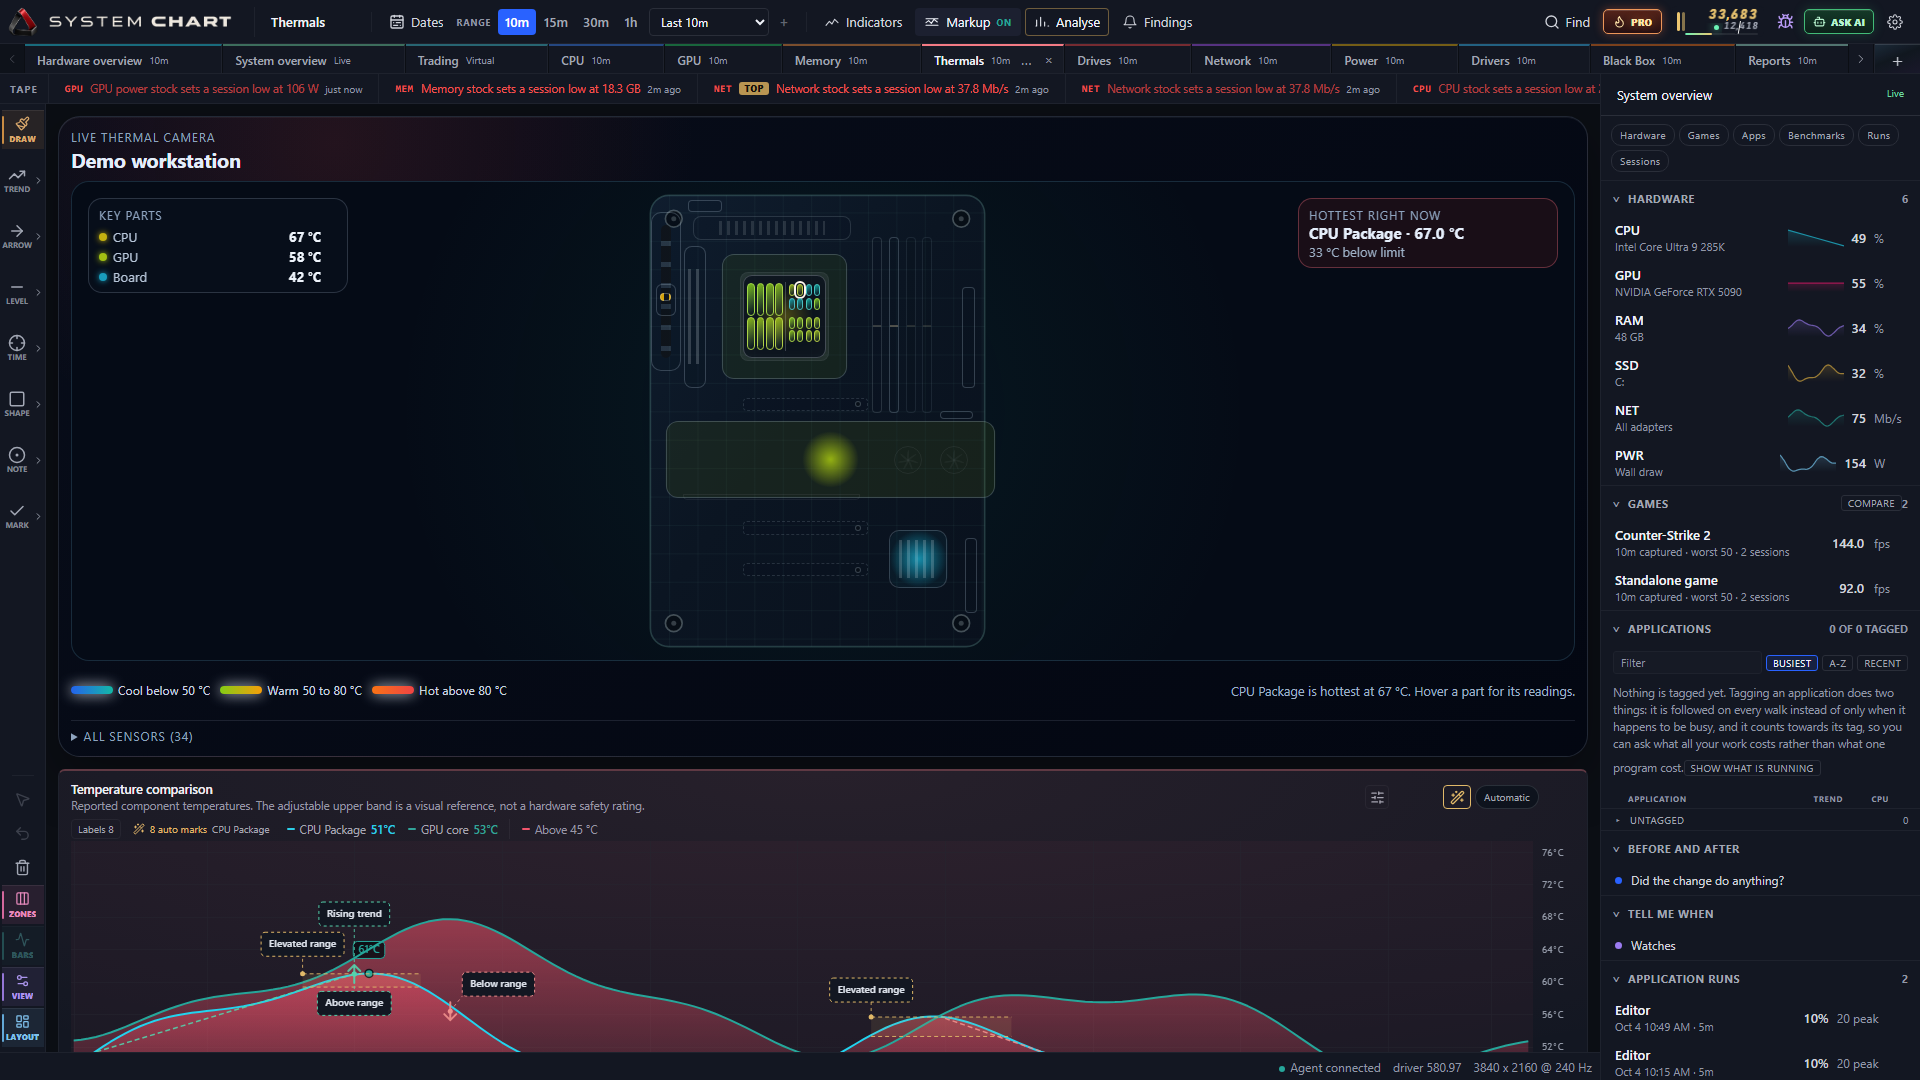
Colored temperature reference bands are adjustable visual guides, not universal damage or throttling thresholds. Timing and correlation do not establish a cause.
Thermals is Free. Illustrative readings in the actual app; unavailable sensors are not invented.
06
SQL Workbench
Open the SQL Workbench tab in the default workspace. Saved SQL remains readable in Free, including existing drafts; already displayed results remain inspectable and exportable. Pro can load a bounded selection, author read-only SQLite queries and run them in an isolated in-memory worker. Saved SQL never runs automatically and cannot write to the capture database.
Open the SQL Workbench tab, or restore it from the + page menu if it is closed. Pro can add, pin and rename independent SQL pages; each keeps its own draft and source choices.
Choose sources, game sessions or application runs, then select a past interval of up to 31 days.
Select Load data. The loaded-snapshot status gives the actual interval and table counts.
Choose a starter or write a SELECT or WITH query. Select Run.
Switch between Table and Chart. Choose points or lines for timestamps, or bars for categories. Select axes and enter a unit.
Export CSV or save the query for later. Saved queries never run automatically.
Eight starters select their own source families and chart mappings. A changed selection requires Load data again. Saved queries retain their chart view, axes and unit.
Example: CPU activity over time
SELECT timestamp_unix AS time,
       ROUND(average, 1) AS cpu_percent
FROM reading_buckets
WHERE symbol = 'cpu' AND metric = 'load.avg'
  AND timestamp_unix >= $from AND timestamp_unix < $to
ORDER BY time;
The six tables are reading_buckets, game_sessions, application_runs, capture_intervals, gpu_sources and sensor_catalog.
History rows are returned buckets, not guaranteed raw ticks. Row averages are not automatically duration-weighted. Do not average session percentiles into a combined percentile.
Limits include 25,000 loaded rows, 16 MiB of input, 10,000 result rows, a three-second execution budget and 5,000 plotted rows. Cancel stops the query worker.
Agent workflow: use Copy agent context, or Ask assistant. The agent reads query_schema and offers draft_query. Review the SQL, choose Use draft, then explicitly Load data and Run. A generated draft is a proposal, not an executed query.
07
Connect an AI assistant
Bring AI into your analysis with SystemChart Pro. Settings, AI assistants offers in-app chat and connections to external clients, using a model you choose. Hosted services receive your question and requested evidence; use a model running on this PC for local inference.
In-app provider presets include OpenAI, Anthropic and Azure AI Foundry for hosted models; Ollama, LM Studio and Foundry Local for a local server; and Anything else for a compatible chat-completions endpoint such as vLLM, llama.cpp or OpenRouter. Supply your own running model, endpoint and any required API key. Model availability, tool support and costs depend on that provider. A local endpoint keeps inference local; connecting to a hosted endpoint sends the requested context to that service.
SystemChart Pro is an ownership-based upgrade, not a recurring SystemChart subscription. Model access is separate. A local model can power in-app answers without a paid provider subscription. Pro DLC remains unavailable publicly on Steam; developer/review access does not change that.
You use
In AI assistants
Where you ask
The Claude desktop app
Claude, then Add SystemChart to Claude
Claude
A local Codex client
ChatGPT, then Add SystemChart to Codex
The client that reads the saved Codex configuration; verify a SystemChart tool call there
Ollama on this PC, or an OpenAI, Anthropic or compatible API key
In SystemChart, open Settings, choose AI assistants, then Claude, and select Add SystemChart to Claude.
Close and reopen Claude so it sees SystemChart.
Ask Claude What has been using my GPU today? Once Claude has read your readings, step 3 on the page says when.
SystemChart makes a timestamped backup of Claude's configuration before changing it, changes only its own entry and refuses to write if the file cannot be read. Details on the page shows the file, the backup and the entry to add by hand. Disconnect removes only SystemChart's entry.
Codex and external ChatGPT clients
Use a local Codex client that supports your saved MCP configuration. OpenAI's MCP setup guide describes Codex configuration.
Sign in in that client. Do not paste a password, subscription token or authentication file into SystemChart.
In SystemChart, open Settings, choose AI assistants, then ChatGPT, and select Add SystemChart to Codex. This saves a SystemChart entry in .codex/config.toml; it does not connect an ordinary browser conversation.
Restart the client that reads that file, inspect its available MCP tools and verify that systemchart is available.
Ask: Use only SystemChart's capture_status tool. Is capture running, and how much history is held? Do not change anything. Re-check in SystemChart to see whether a tool call was observed.
Configuration saved, a past observed tool call, and access in your current chat are different states. Opening chatgpt.com or copying a question does not verify access to your PC. For answers that stay inside SystemChart, configure an in-app model.
Codex CLI alternative
Sign in with codex login. Details on the ChatGPT page shows the Codex entry with the installed path of systemchart-mcp.exe. From PowerShell, codex mcp add systemchart -- followed by that quoted path does the same; check it with codex mcp list. A Steam library can be on any drive, so use the path the page shows.
A ChatGPT subscription is not an OpenAI API key. OpenAI currently includes Codex with Plus, subject to plan limits and workspace policy. API-key usage follows the separate API account. See authentication and current availability.
Answers inside SystemChart
Install and start a local model server, or choose a hosted API provider. For example, an existing Ollama installation can run a model you have pulled; no cloud sign-in is required for local inference.
In SystemChart, open Settings, choose AI assistants, then In-app answers. Enter the model or deployment name, the endpoint when required and your API key if the service needs one.
Save and run the connection test. Model access and successful tool use are checked separately; saved settings alone do not prove that the model can answer with SystemChart evidence.
Open Ask AI in the top bar. Ask about the selected chart, an indicator, a saved report or a captured interval. Inspect the evidence and its time bounds before relying on a conclusion.
With an API key, choose OpenAI, Anthropic or Other instead and paste the key. Windows encrypts it under your account before it is stored, and it is never given back to the window. Claude Pro and ChatGPT Plus do not pay for in-app answers.
The in-app conversation uses your model to explain retrieved diagnostic evidence and bundled product guidance. Saved-report questions can read the selected report's saved snapshot rather than substitute current readings. Replies are generated text and can be mistaken; missing capture remains missing. Supported setting and case-label changes still require a separate review and Apply. No model or key is bundled, and a connection test does not establish every question or model's reliability. A successful developer setup does not grant Pro to another account.
Ask in your browser
Browser prepares a short summary of what you are looking at: your processor, graphics card and memory, the page and range, a few readings, the busiest apps and any findings or Black Box incidents. Review and copy the summary, then paste it into your browser chat. The external site writes its own reply. This is a snapshot handoff; it does not grant that chat live access to the recorder or all your history.
VS Code and other MCP clients
SystemChart's tool server is systemchart-mcp.exe, a local stdio server in the installation folder. Details on the Claude or ChatGPT page shows its path. Claude uses mcpServers; VS Code uses servers with type: stdio. Merge the entry instead of replacing the whole file, then in VS Code run MCP: List Servers, start SystemChart and enable its tools for agent chat.
Do not expose port 5274 through a tunnel, router or public reverse proxy. It is a local recorder API, not an authenticated remote MCP service. A browser-hosted or cloud agent cannot reach this PC's localhost; use a local client, the browser summary or an evidence export you have reviewed.
What can an assistant change?
Open Chat from any chart or template, or use Quick Find's contextual Chat entry. Closing the panel retains the current conversation. View tools can open supported pages, set supported chart ranges, add studies and change automatic markup. SQL drafts require review and never execute automatically.
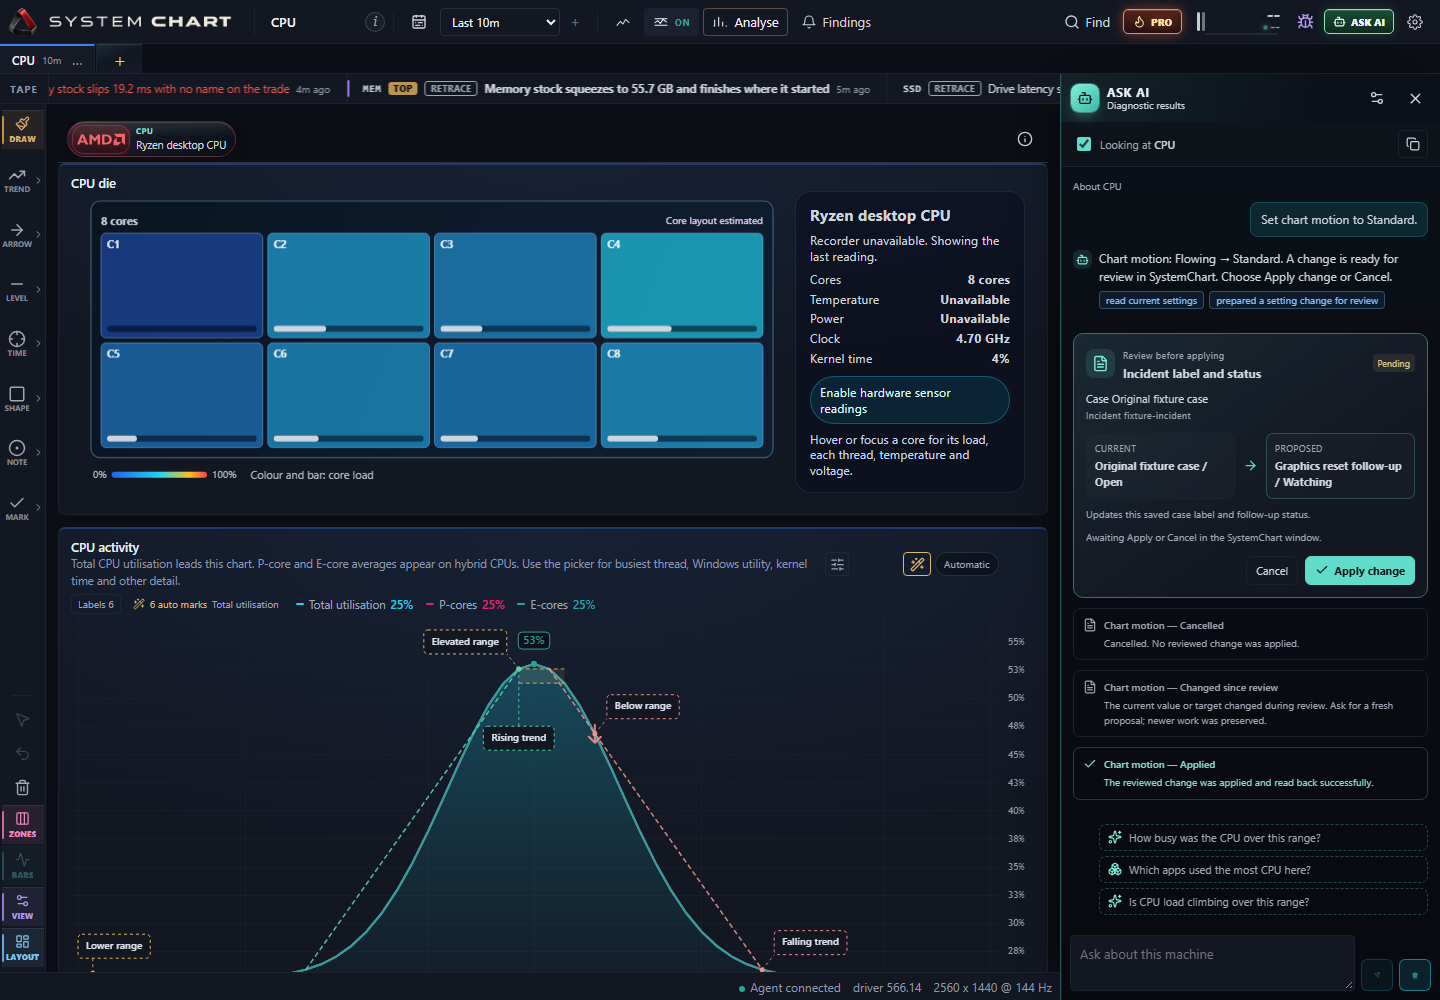
Assistants can propose supported presentation changes: chart motion, theme, clock format, Black Box incident filters and startup notice, and frame-counter visibility, position, size, readings and appearance. They can also propose a case label and follow-up status. Read the old and new values in SystemChart, then choose Apply or Cancel. A changed or expired target needs a fresh proposal; an assistant cannot approve its own change.
A case-change review in the actual app, backed by an isolated native recorder fixture. The incident and request are illustrative.
Application tagging writes a bounded category assignment and makes those applications part of continued capture. It cannot create categories or overwrite your manual tags. AI assistants can give back every category an assistant set in one click, in either edition, and categories you chose stay.
There are no tools to end processes, install sensor drivers, change capture settings, delete history, upload reports or execute SQL. External clients control their own responses and approval policy.
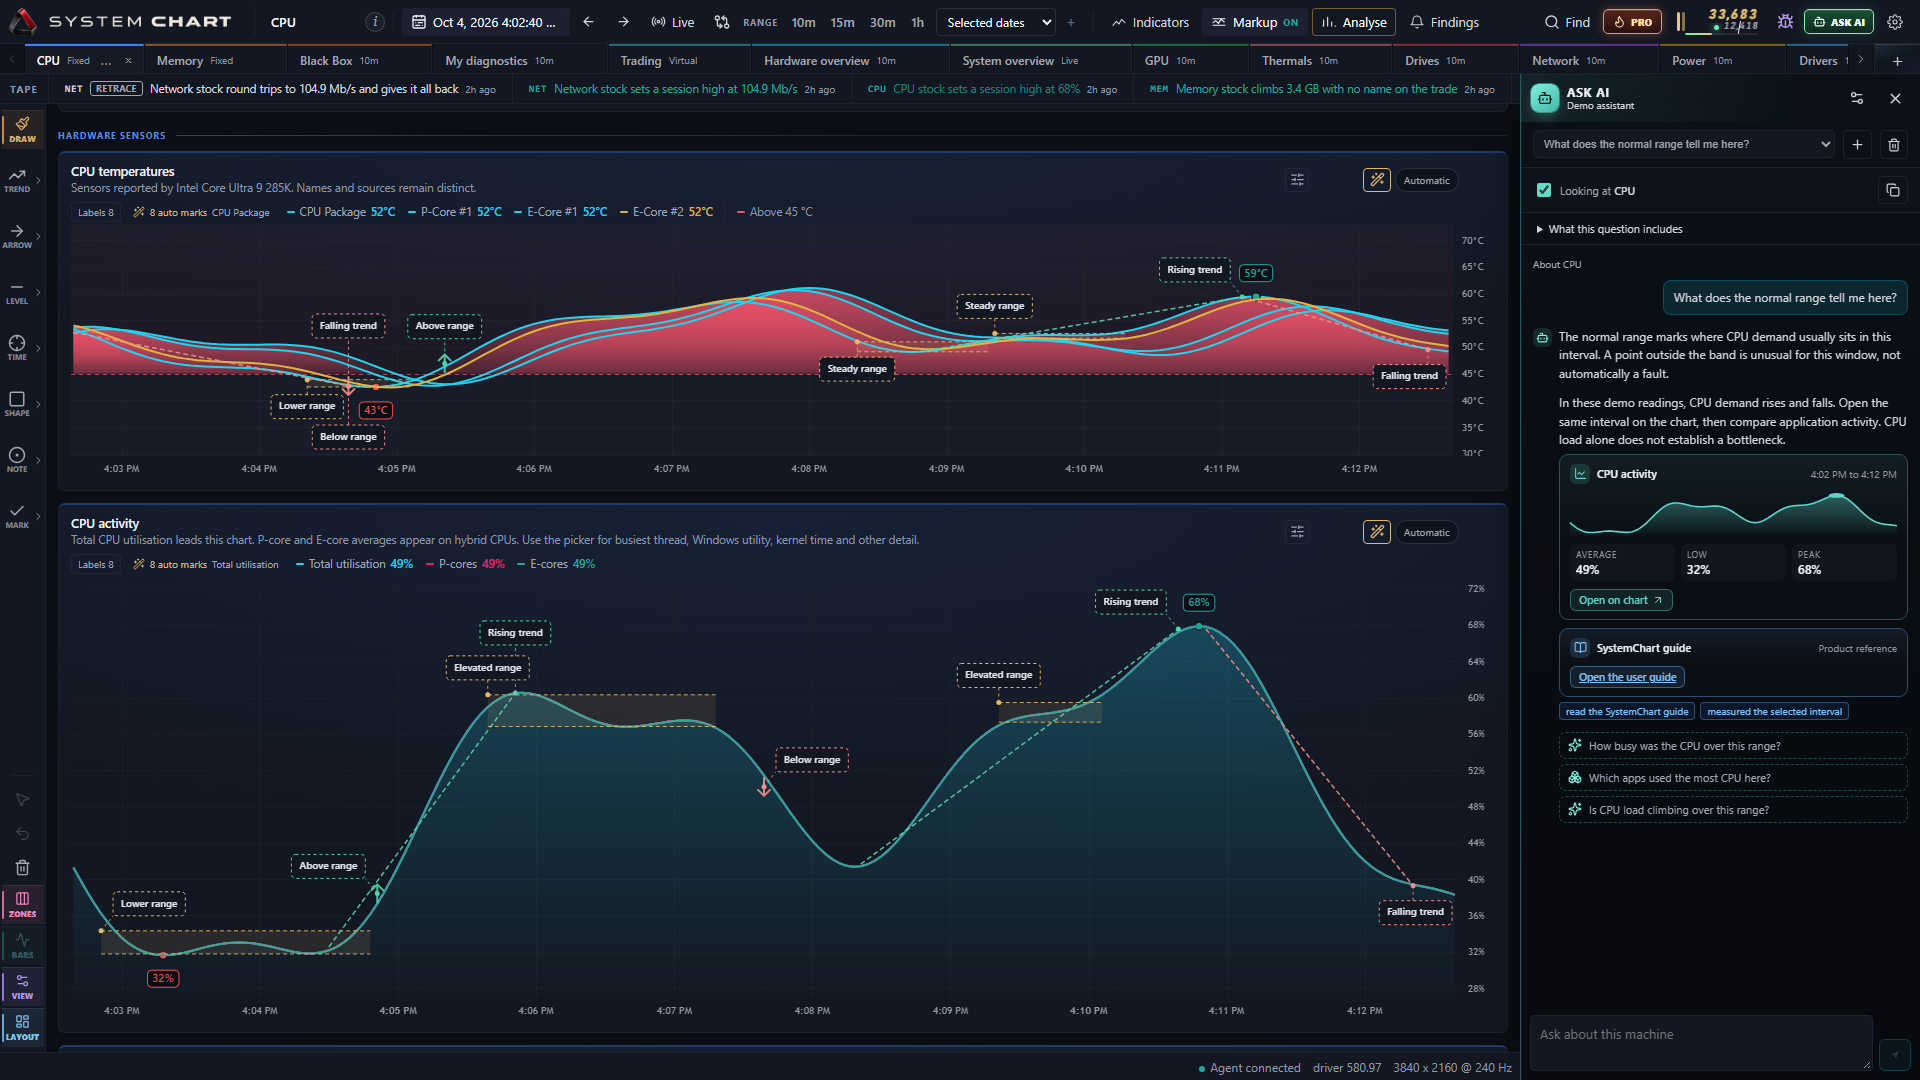
Assistants can read live processes, application runs, annotations, sensor status, saved benchmarks, exact-interval statistics, Black Box incidents and, when you ask about drivers, the driver inventory. The power_rank tool reads the same offline CPU/GPU reference used by System Rating. Pro can copy an assessment prompt from that page for a separate external-agent opinion; copying does not call a model, and an AI assessment cannot replace the offline index.
Pro assistant in the actual app. Illustrative question, answer and readings; no external model was called for this capture.
08
Sensors and frame capture
Basic CPU, memory, drive and network readings use Windows facilities. GPU availability varies by adapter and driver. NVIDIA can expose extra board sensors. AMD and Intel currently use basic Windows GPU counters.
A dedicated VRAM percentage requires matching used and total dedicated memory from the selected adapter. Unknown capacity stays unavailable; it is not zero, shared system memory or another card's capacity. GPU memory use and GPU engine utilization are different signals. Temperature, clocks, voltage and board power appear only where reported.
Open System Rating to identify the CPU, selected GPU, RAM and drives.
Open Settings, Hardware sensors to review optional CPU and motherboard capture.
If you choose setup, review the separate installer and Windows permission prompt. Installation is never triggered by an LLM.
Return to SystemChart and enable the installed sensors. If a name is unmapped, its physical location is unknown.
For game frame timing, use Settings, Capture to check PresentMon and tracing permission. The frame counter supports windowed and borderless presentation.
VID is requested voltage, not necessarily measured Vcore. Thermal headroom is distance to a limit, not the component temperature. Estimated wall power is not a plug-in meter reading.
System Rating
Free includes a bundled offline CPU/GPU rendering-reference index. The 0.9.38 catalog contains 691 exact device references from Blender Open Data 4.5, with at least five community submissions per model. Source links, counts and the snapshot date appear with the result.
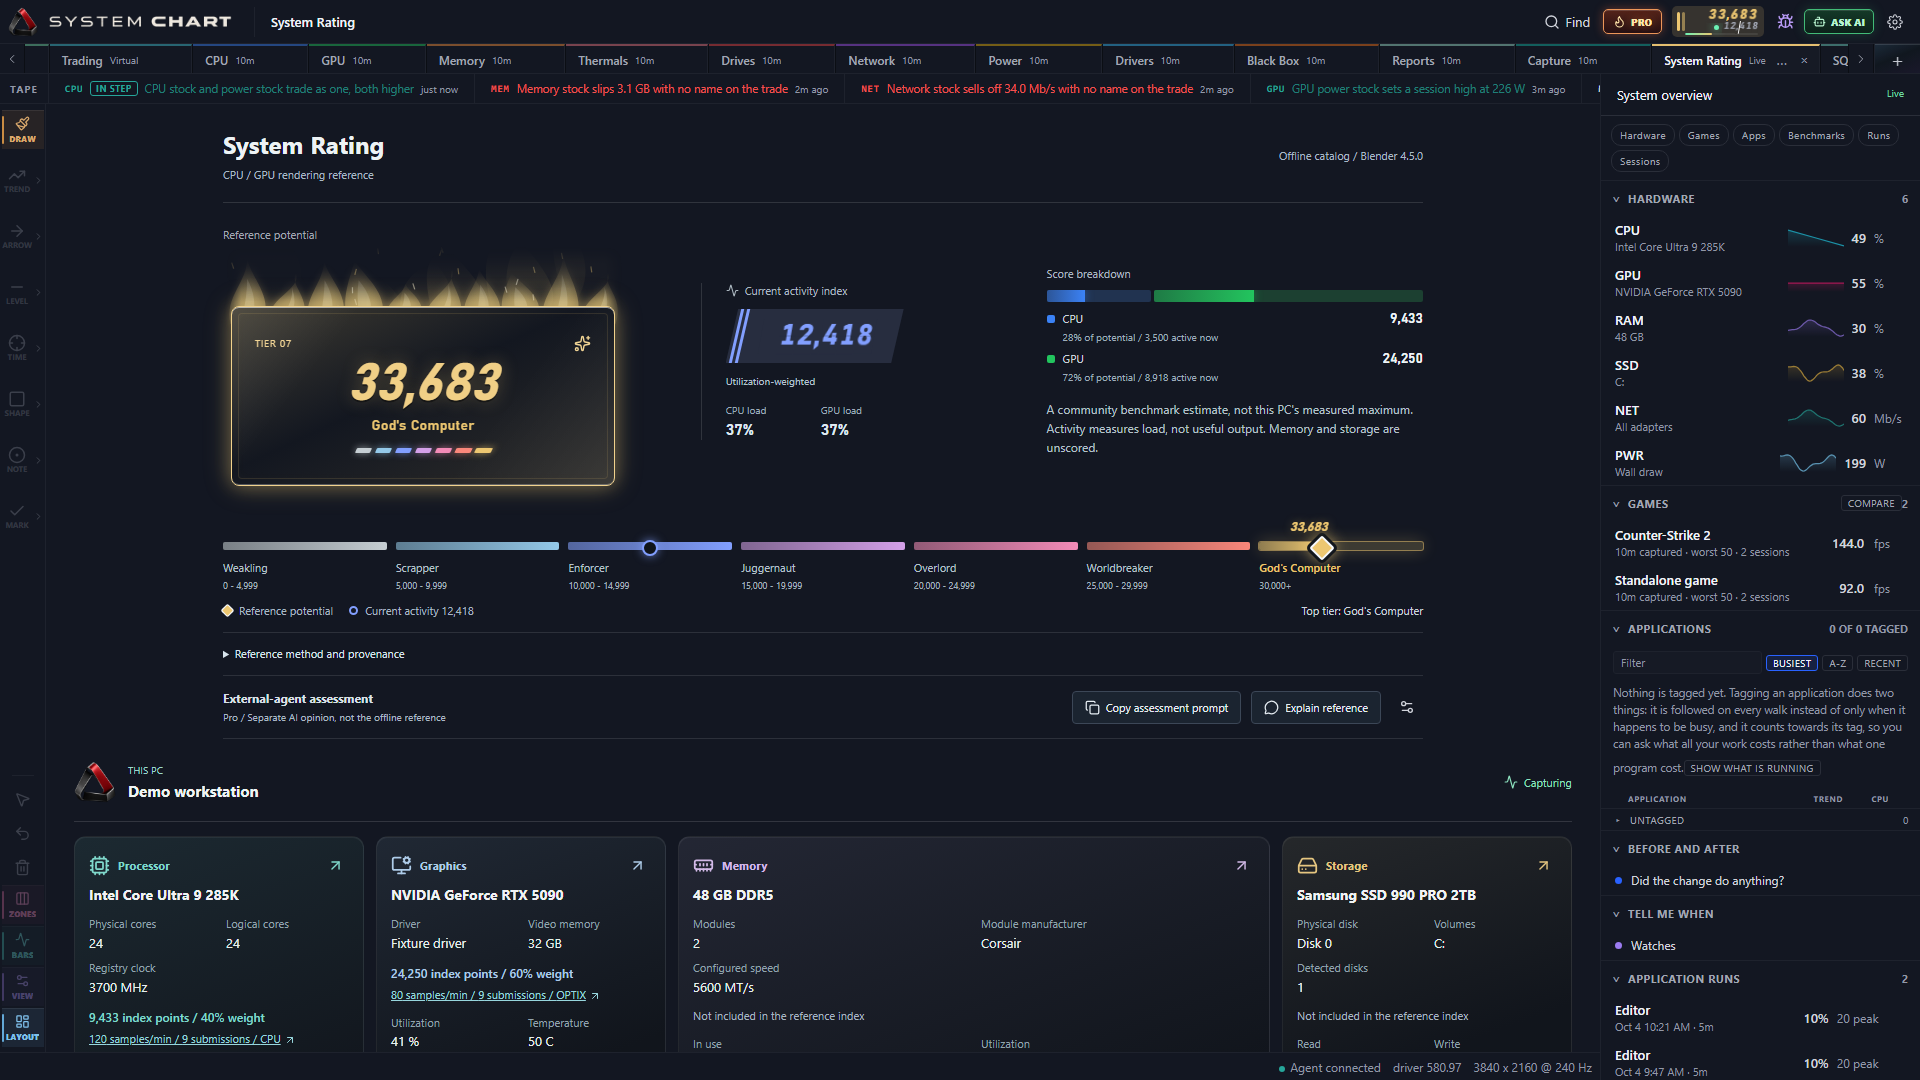
The tier-colored badge separates reference potential from current activity. Decorative effects do not change the reference score and stop when the page is hidden or reduced motion is enabled.
Reference potential is fixed. The animated badge is a utilization-weighted activity index, not useful output. Neither value is a measured maximum, FPS prediction or full-system benchmark. RAM and storage are visible but unscored. Unsupported models stay Unranked; stale or paused activity stays unavailable.
Reference formula and limits
Formula cycles-reference-v1: 30000 * (0.4 * CPU median / 1000 + 0.6 * GPU median / 10000). Medians are Cycles samples per minute, summed across scenes. The current index multiplies each contribution by its latest valid utilization. The scale is fixed, not a percentile. Community results span operating systems, drivers and power limits, so no accuracy percentage is claimed.
The first snapshot was collected September 15, 2026. No benchmark workload, catalog download or hardware upload runs automatically. Pro's optional external-agent assessment is a separate, labeled opinion.
System Rating is Free. Illustrative readings; reference estimates and measured activity remain distinct.
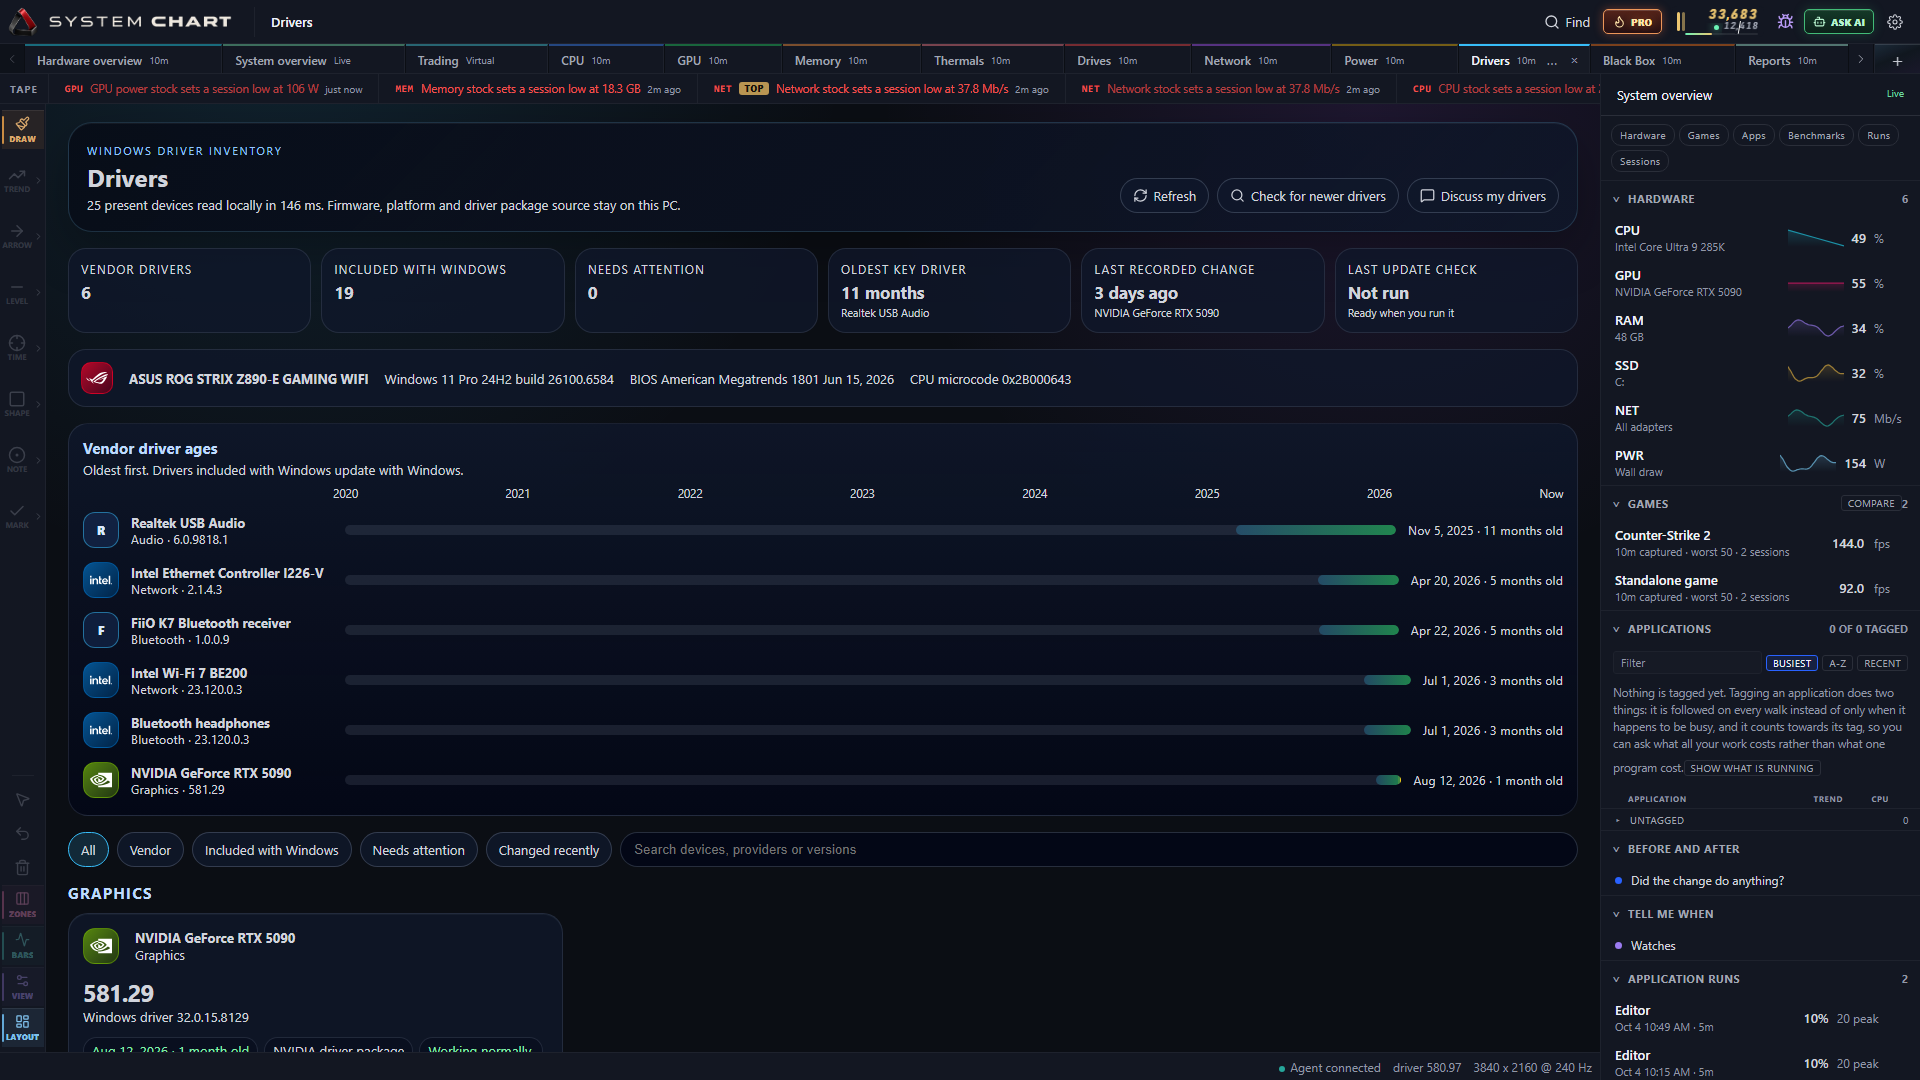
Drivers and firmware
Open Drivers for the local Windows device inventory, driver makers, versions, dates, source and reported problems, plus BIOS and platform details. Official vendor support links are available in Free. Pro can explicitly ask Windows Update which drivers it offers; this searches only and never downloads or installs a driver.
Local driver inventory is Free. Illustrative devices in the actual app; age alone does not mean a driver needs replacing.
Place the FPS counter
In Settings, Frame counter, drag the sample along any of the primary screen's four edges. Arrow keys or the edge and percentage controls give precise placement. A drag saves once on release; Escape cancels. Corner shortcuts remain available, and placement is Free.
The counter is a click-through desktop overlay, not an injected game overlay. Windowed and borderless modes are supported; exclusive fullscreen and every game's protection software are not guaranteed. Frame capture also depends on the game and local tracing permissions.
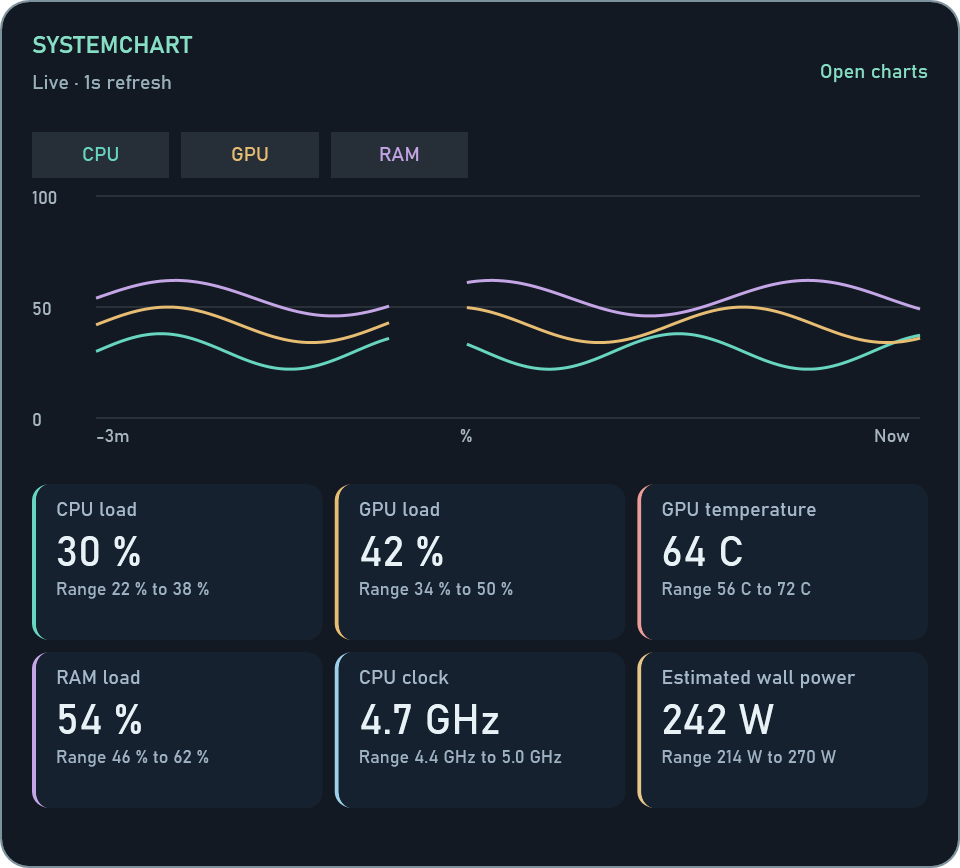
Native desktop widget
Pro can keep selected readings and small history graphs on the Windows desktop. Choose graph, readings or combined mode, compact or comfortable spacing, colour, width, monitor and placement. Reading presets and ordering help you keep the useful values together. Optional recorded ranges and a 1, 2 or 5 second refresh interval adjust the presentation; they do not change recorder capture quality.
Missing readings stay unavailable and recorded gaps remain gaps. Losing Pro hides the widget while preserving its preferences. The underlying supported sensors and ordinary charts remain Free.
Native desktop widget, Pro. Actual Windows interface with demo readings; the recorded gap is deliberately preserved.
09
Free and Pro
Free is a complete capture and default-chart experience. Pro adds authoring, comparison and presentation tools to the same installation. Pro is planned for Steam and is not currently available there.
Workflow
Free
Pro adds
Capture and sensors
Same supported readings and full capture quality
No extra sensor accuracy
Built-in charts
Default hardware and game pages, sensor selection and automatic markup; SQL is read-only
Custom workspaces, manual studies and drawings
Drivers
Local device inventory, firmware details, history and vendor support links
Explicit Windows Update search and assistant discussion
System Rating
Offline CPU/GPU reference catalog and activity index
Separate external-agent AI assessment
Black Box
Windows System and Application incidents, nearby application context, case labels and status, and HTML incident reports
Incident diagnosis and reviewed case proposals through the assistant
Evidence
Ordinary CSV, JSON and image exports; saved reports stay readable
Weekly and monthly scheduled HTML reports
Query and compare
Read previously saved work
SQL execution, benchmark comparisons and watch authoring
Presentation
Basic frame counter, size and four-edge placement, icon finishes
Setup documentation and a retained conversation after downgrade
In-app assistant, local MCP tools and reviewed supported setting changes
History
60-day window, within storage constraints
No edition time limit, within the storage budget
Trading Preview
View and export saved account records
Explicit activation, virtual orders, options and margin
When access changes, existing captured data and authored pages remain readable. Editing controls can become unavailable. A missing sensor is a hardware limitation, not a reason to obtain Pro.
The optional Pro overlay defaults to FPS, then CPU utilization and temperature, then GPU utilization and temperature. It stays disabled until you enable it. Missing or stale readings stay unavailable, custom and explicitly empty choices are preserved, and Free keeps the FPS number, size and placement with tier-change effects off.
Quick Find is Free. Use Ctrl+K outside a text field, then search pages, settings, applications or games. Custom names and recent destinations are included; choosing an open page preserves its range. Already loaded destinations remain available during a recorder outage. Free users can open an explanatory chat panel and the read-only SQL page. Restricted drawings and workspace imports state that Pro is required.
10
Troubleshooting
My charts are empty
Check Capture first. Confirm the recorder is running, the selected interval overlaps retained history and the hardware reports that signal. Try the most recent ten minutes. An empty series is not a reading of zero.
The MCP server is listed, but calls fail
Open SystemChart and check its recorder and Pro status. Confirm the configured executable is in the active install folder. Keep the window open for view actions. Use the client's MCP logs for connection errors, without sharing credentials.
Steam cannot replace systemchart-mcp.exe during an update
Disconnect the SystemChart MCP server in each agent client that uses it. Retry the normal Steam update, then reconnect. Do not change file permissions or force-kill your other applications.
A SQL query returns nothing
Check loaded table counts and selected sources. An assistant draft does not load data. Application and game tables contain bounded completed runs wholly inside the interval. Broaden the interval or select the required source, then Load data and Run.
The query works as a table but not a chart
Choose a finite numeric value column. Points and lines need unique Unix-second or ISO timestamps. Aggregate duplicate timestamps or choose one series. Bars use categories. NULL rows are omitted explicitly.
Pro features are unavailable
Open Settings, About and check the edition verification state. On Steam, sign in under the account that owns the relevant entitlement and open the charts again. Capture and existing history remain available while verification is unavailable.
The app will not open
Use SystemChart Support Reporter from the installation folder. It can prepare a support report without loading the charts. Review the contents and choose whether to save or send. See Support.
11
FAQ
Does SystemChart improve my FPS?
SystemChart helps you understand performance and compare the results of changes you make. It records and analyzes evidence; it does not overclock hardware or automatically increase FPS.
Do I need an LLM or an internet connection?
Local capture, charts, rule-based Findings and the SQL engine do not need an LLM. A hosted model needs its provider connection. Steam installation and current ownership verification use Steam.
Is the SQL workbench a remote database service?
No. It loads a bounded snapshot into a temporary worker. File access, database writes, extensions and multiple SQL statements are restricted. Saved SQL stays in the local UI profile.
Can I use my ChatGPT Plus subscription?
Yes, through an eligible local Codex or supported ChatGPT desktop client signed in with ChatGPT. SystemChart MCP access separately requires SystemChart Pro. The in-app API field does not accept a ChatGPT subscription token.
Does Free capture lower-quality data?
Free and Pro use the same supported sensors and full-detail capture. Pro extends the experience with workspace authoring, advanced comparisons and longer retention.
Are missing temperatures a Pro restriction?
No. Check hardware support, optional sensor setup and the selected adapter. Unknown values stay unavailable.
Does closing the chart window stop capture?
In the Steam build, closing the chart window leaves the recorder running. Use the capture controls or quit the recorder when you want capture to stop.
Is System Rating available?
System Rating is included in Free, using a bundled CPU/GPU rendering-reference catalog. It is not a full-system benchmark or measured maximum. RAM/storage are unscored, and an LLM cannot alter the offline index. The public application remains Coming Soon on Steam.
12
Trading development preview
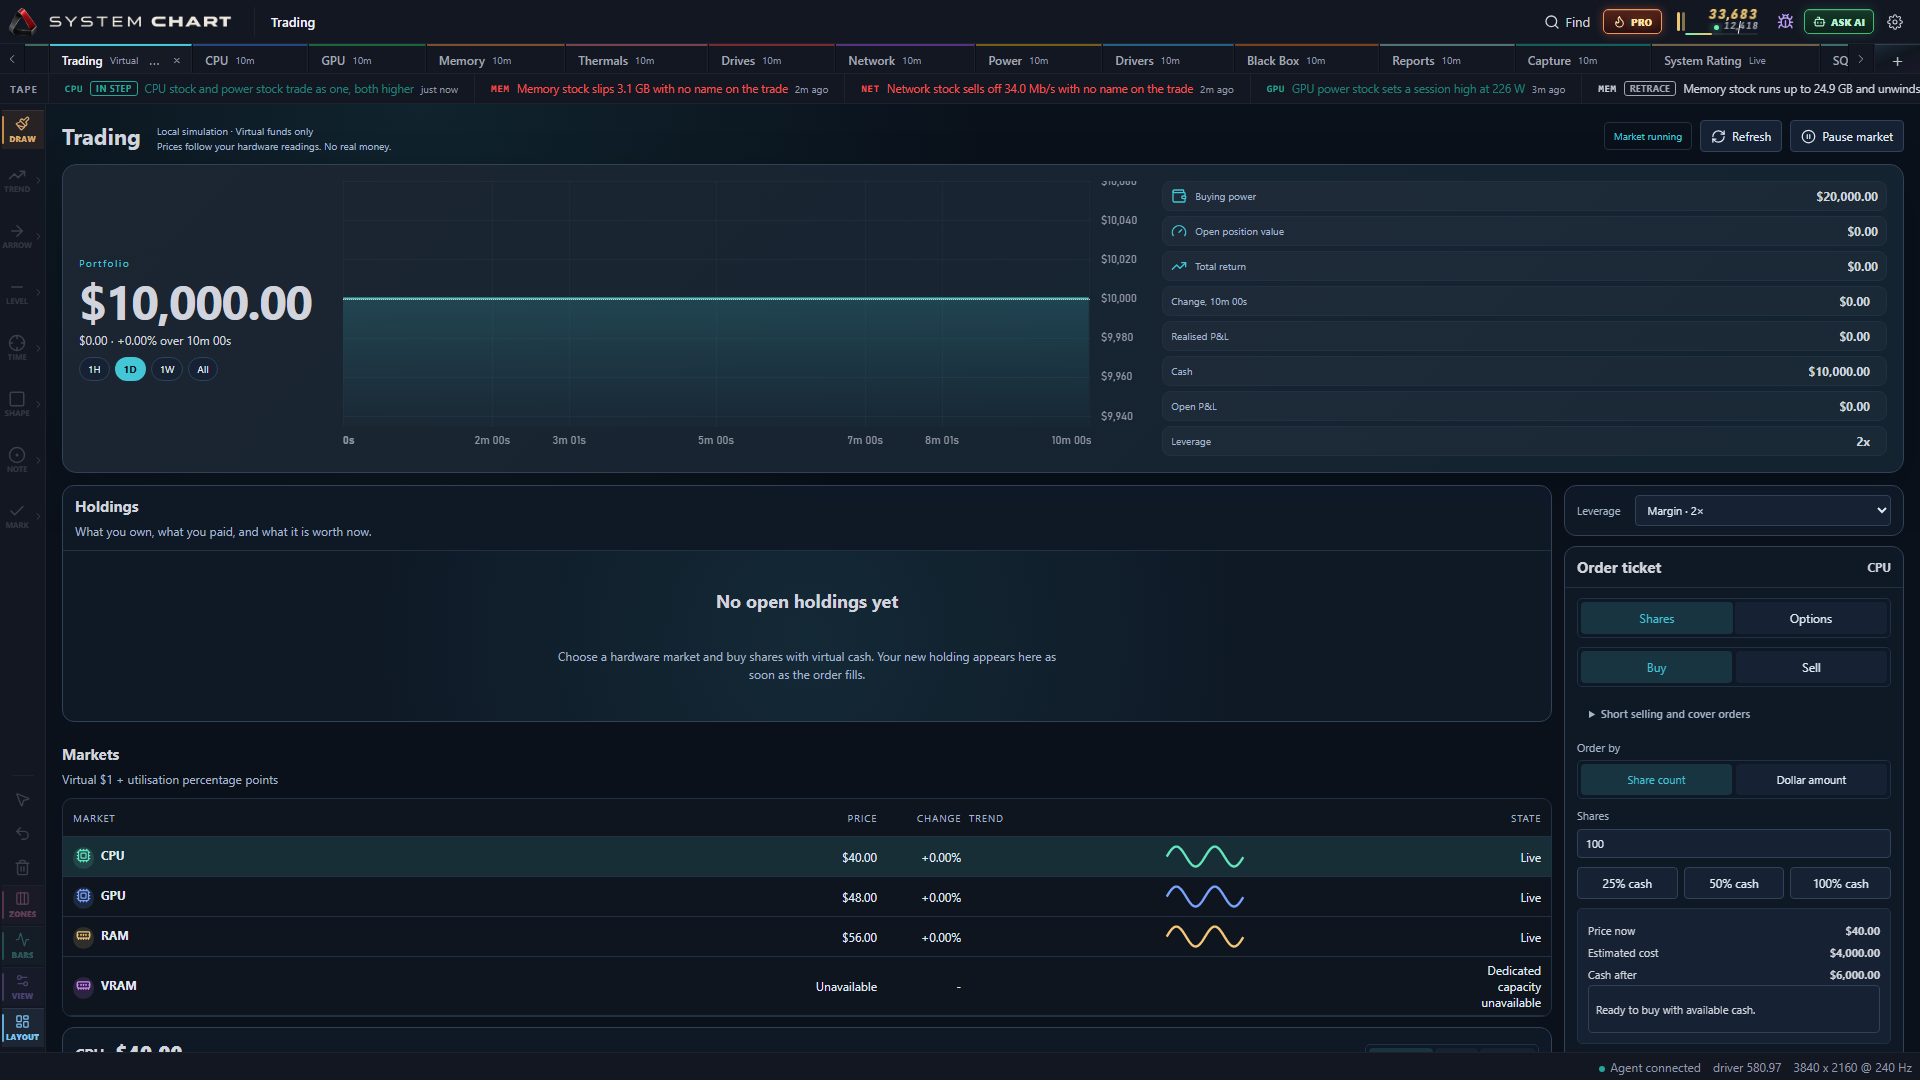
This optional Pro feature is part of the developer/review preview. Trading is a portfolio desk with net worth, equity, buying power, invested value, returns, holdings against average cost, allocation, a watchlist and a candle chart with volume and cost line. Pro DLC is not currently available publicly on Steam.
Virtual markets are still driven by CPU, GPU, RAM and VRAM source categories. Previous source records remain available separately, preserving their positions, orders and history. Temporary missing readings keep their current market identity and cannot fill orders using guessed prices.
The order ticket is unchanged and retains its estimated cash and margin rows while refreshing. Updating or retained estimates are not permission to submit a stale order: current account, source and risk checks still apply. Option expiry uses observed market minutes, not a calendar date.
Start with $10,000 in virtual cash. Available CPU, GPU, RAM and VRAM readings drive virtual prices in a local, opt-in simulation. Explore long and short positions, working orders, options and margin. Leverage can trigger simulated liquidation and a negative virtual balance.
This is not real investing: no real assets, deposits, withdrawals or hardware resale valuations are involved. Free can view and export saved account records; account activation and new simulation activity require verified Pro.
Open Trading, the third tab in a fresh development workspace. Activate the account explicitly with Pro.
Select a hardware instrument and inspect its source and freshness. An unavailable or stale source cannot fill an order.
Review the virtual order and its margin impact before confirming. Limit and stop orders wait for eligible fresh observations; an accepted order is not necessarily filled.
Pause the market to stop simulation progress. Time without valid observation does not become unseen trading time; option expiry uses observed simulation time.
A market paused only for a Pro check resumes when ownership is verified again. A pause you chose stays paused until you resume it.
Export account and event records locally when you want an archive. An explicit reset archives the previous account and starts a new virtual account.
Closing the chart window does not necessarily stop the independently running recorder or Trading observation. Use the market pause control when you want simulation progress to stop.
Trading requires Pro for new simulation activity. Actual app with illustrative readings; all cash and positions are virtual.