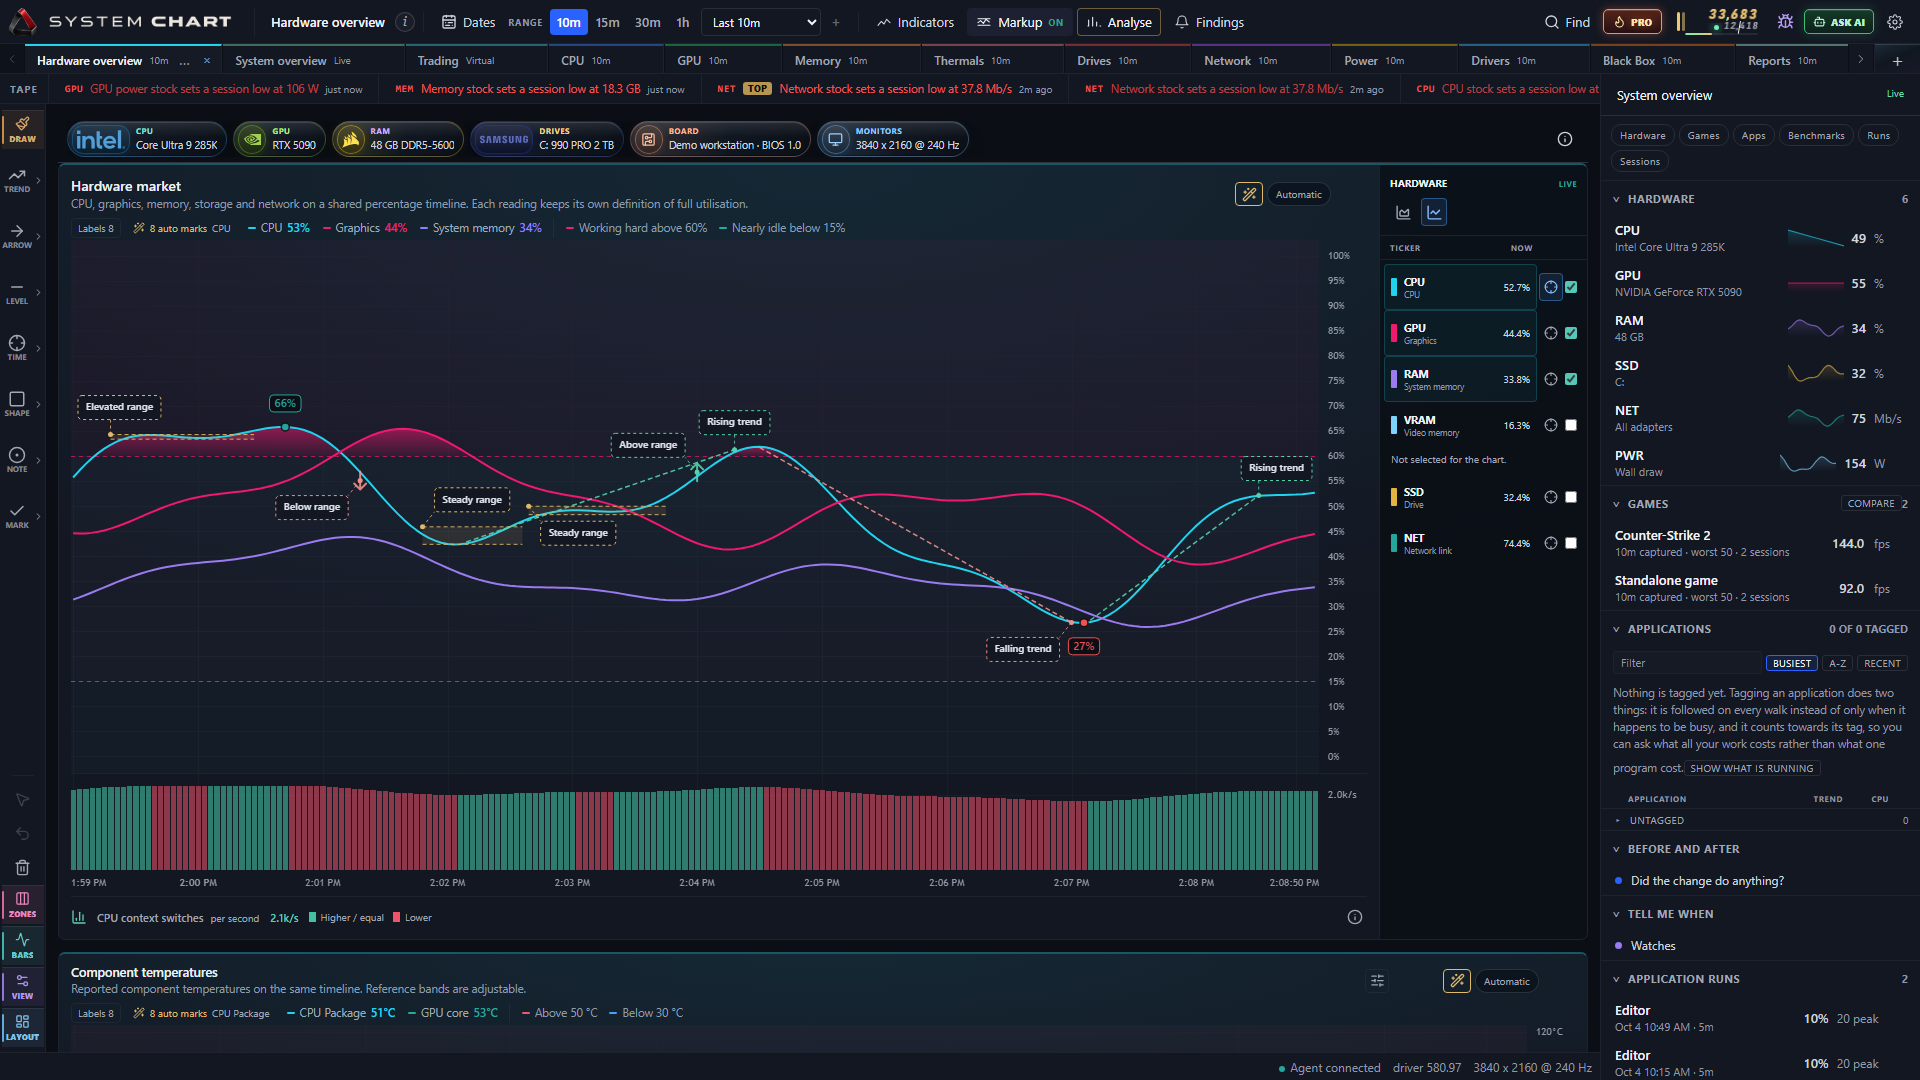

Most monitors show you now. This one keeps the last year.
Your PC produces thousands of readings a second and throws almost all of them away. SystemChart writes them down. When a game stutters, a fan spins up, or the machine gets slower over a month, you can go back and find the moment it started.
- Resolution
- 1 s
- Per reading
- 2.8 B
- A day of history
- 22 MB
- Capture cost
- 0.8 %
- Machine series
- 52
- Assistant tools
- 20
- Price
- Free
What it is
A flight recorder for the machine you are sitting at.
Task Manager tells you about this second. That helps right up to the moment the problem has passed, which is most of the time. The stutter happened during the match. The temperature spiked while you were downstairs. The machine has been slower since an update nobody wrote down.
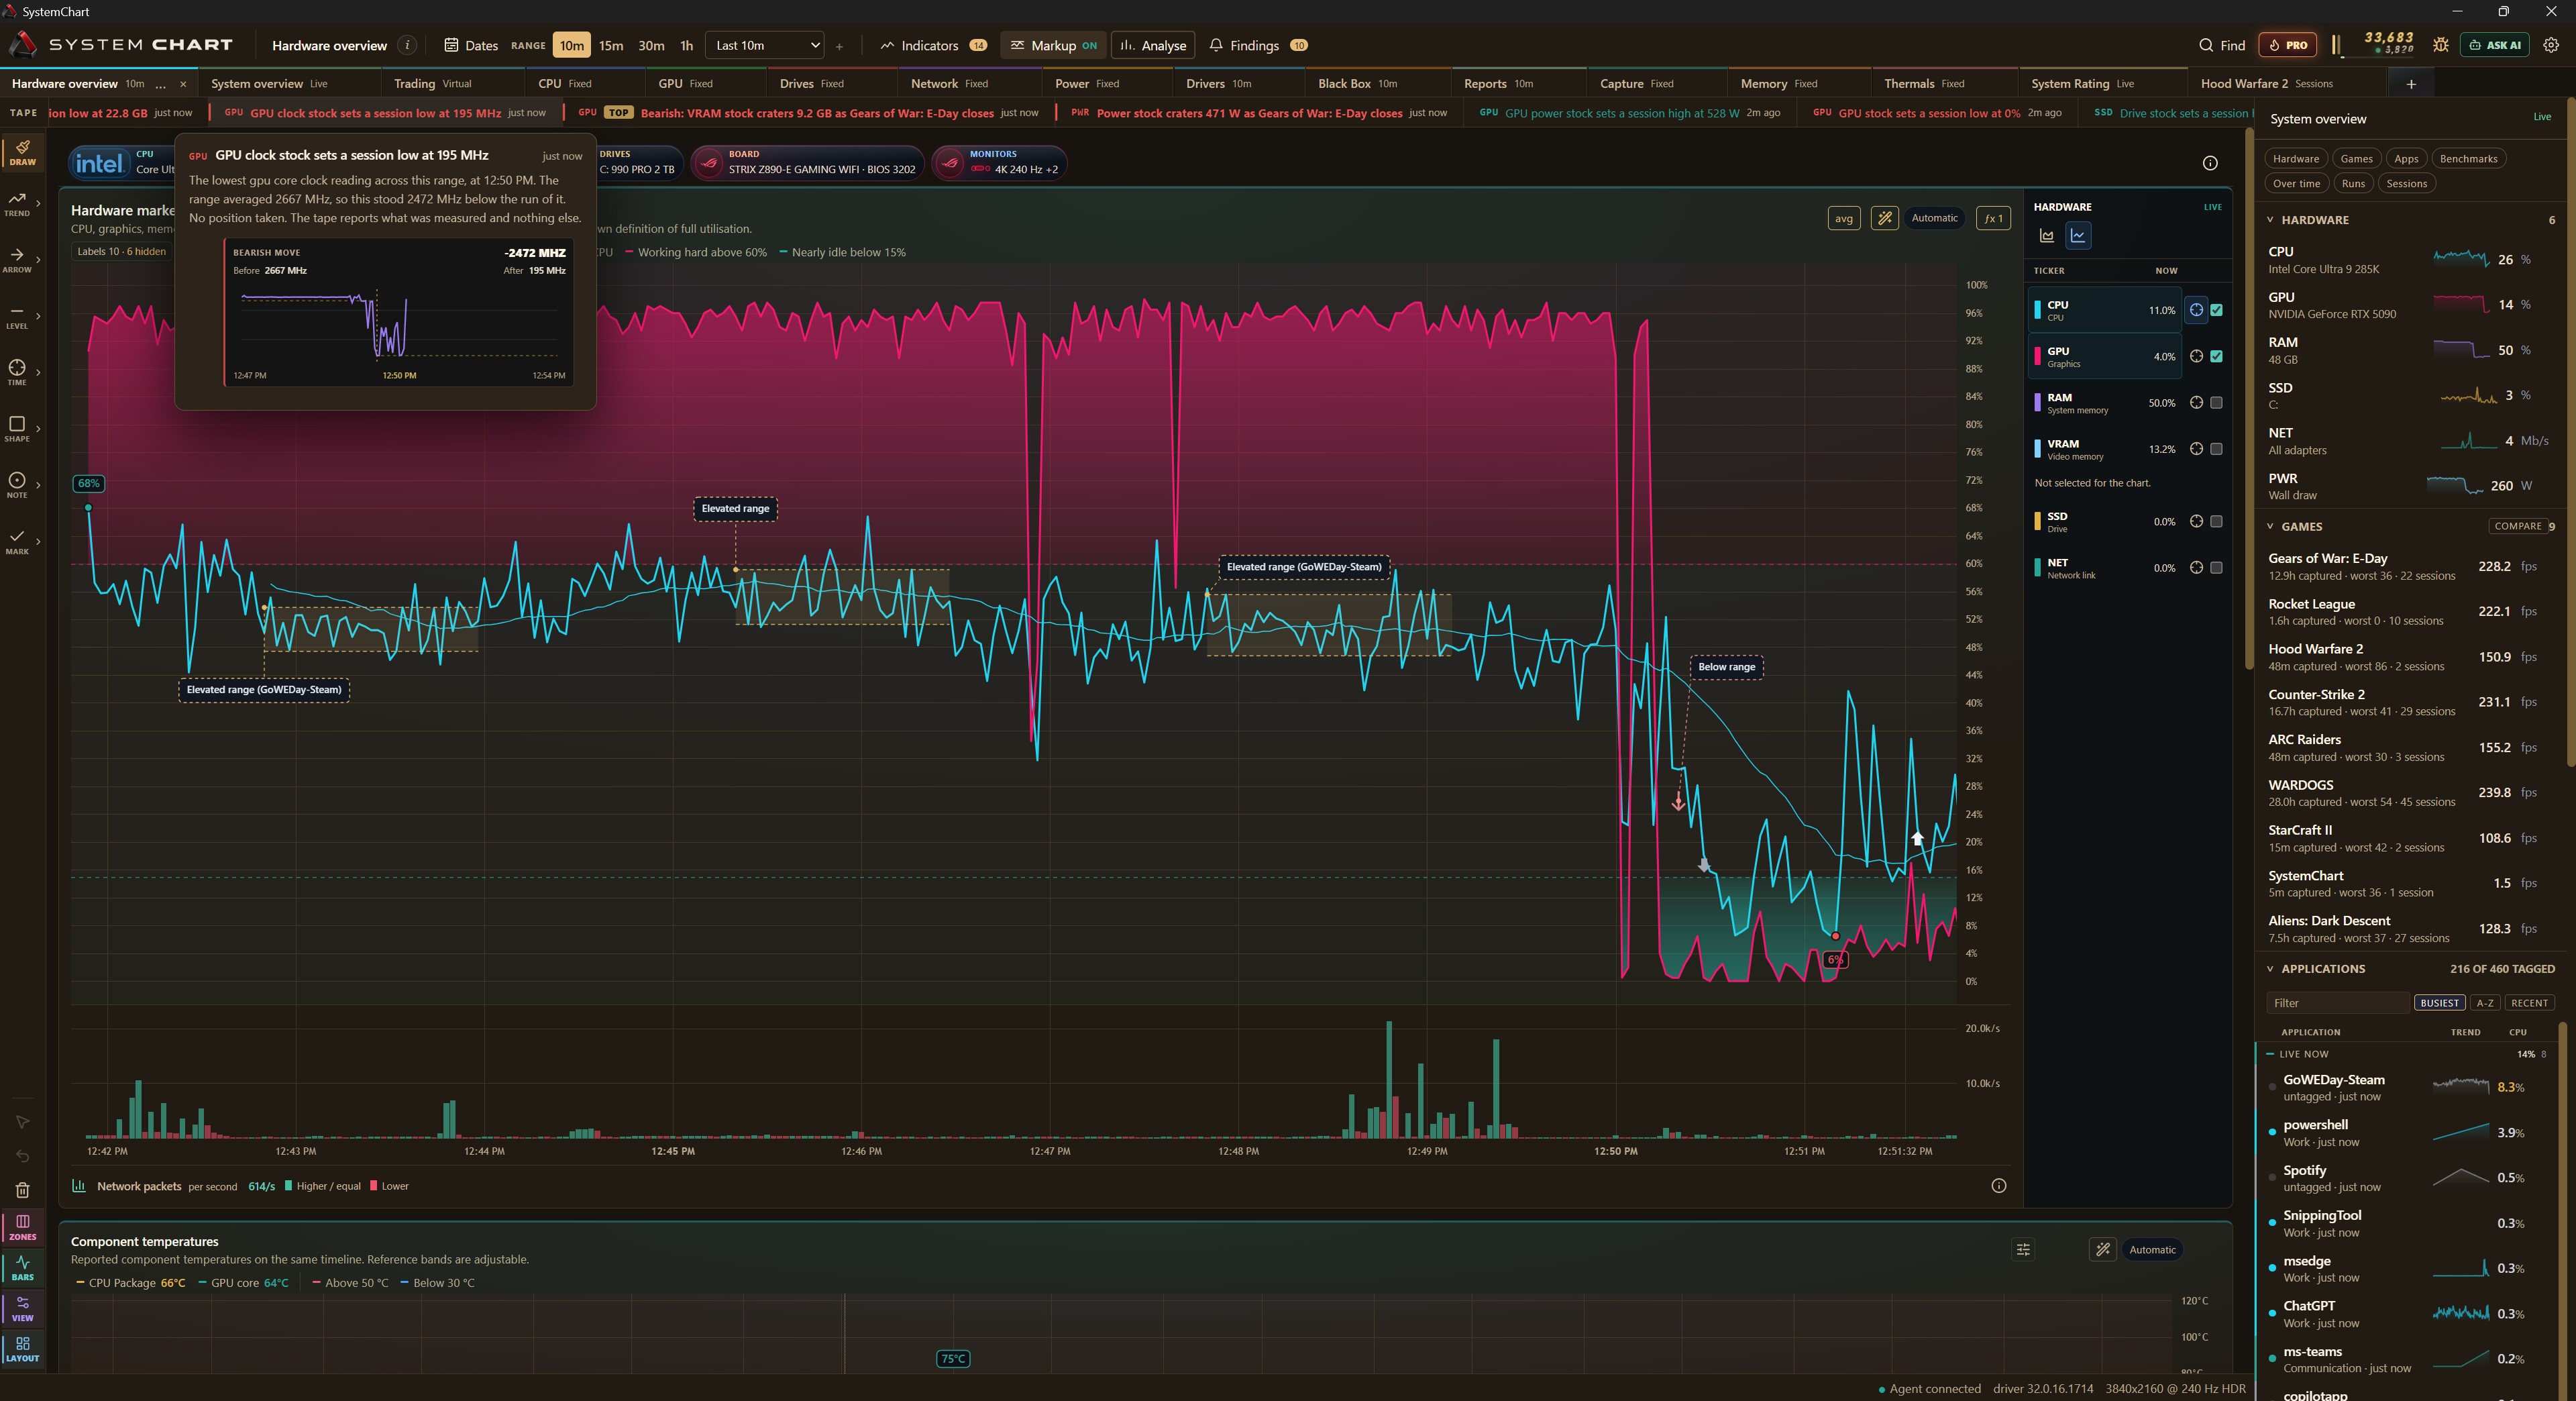
SystemChart runs continuously and keeps what it captures at full resolution. No averages, no five minute summaries. One reading a second for every part of the machine, held for as long as you have room. On top of that sits a trading terminal, because a question about a computer over time has the same shape as the questions charts were built to answer.
The counters it reads are ones Windows and your drivers already keep. It creates no work of its own, and it measures what it costs so you can check that on the Capture page.
Never thinned out
Old readings keep their resolution. A second from last March is the same second it was the day it was captured.
A day of everything
Delta encoded down to about 2.8 bytes a reading. Choose a budget of 1, 5, 10 or 20 GB. When it fills, the oldest seconds drop off the end.
Cheaper than what it watches
Measured on a real machine, not estimated. Capturing costs under one per cent. The window adds about half a per cent while it is open.
Accounts, servers, uploads
A SQLite file on your disk and a port on loopback. Diagnostics go nowhere unless you press the button that sends them.
Reading it
Charts built for signals, not for prices.
Candles, envelopes, distributions and ranked screeners all carry over to a machine without much trouble. So do moving averages, rate of change and dispersion, which describe any signal.
RSI and MACD do not, and they are absent on purpose. Both encode mean reversion in a price set by an auction. A processor at 100 per cent is not overbought. It is busy.
Time nobody captured is marked on every chart. Nine hours asleep looks like nine hours asleep instead of a smooth line from bedtime to breakfast.
Attribution
Every percentage point has an owner.
A processor at 60 per cent is a fact with nobody attached to it. SystemChart walks the process list and records what each application was taking: processor, memory, disk and video memory. Each one is ranked on its own, because the biggest memory holder is hardly ever the biggest processor user.
Tag the applications you care about and they get recorded whether or not they make the cut that second. Each one has a page showing what it costs to leave running.
What it records
Everything the machine will tell it, every second.
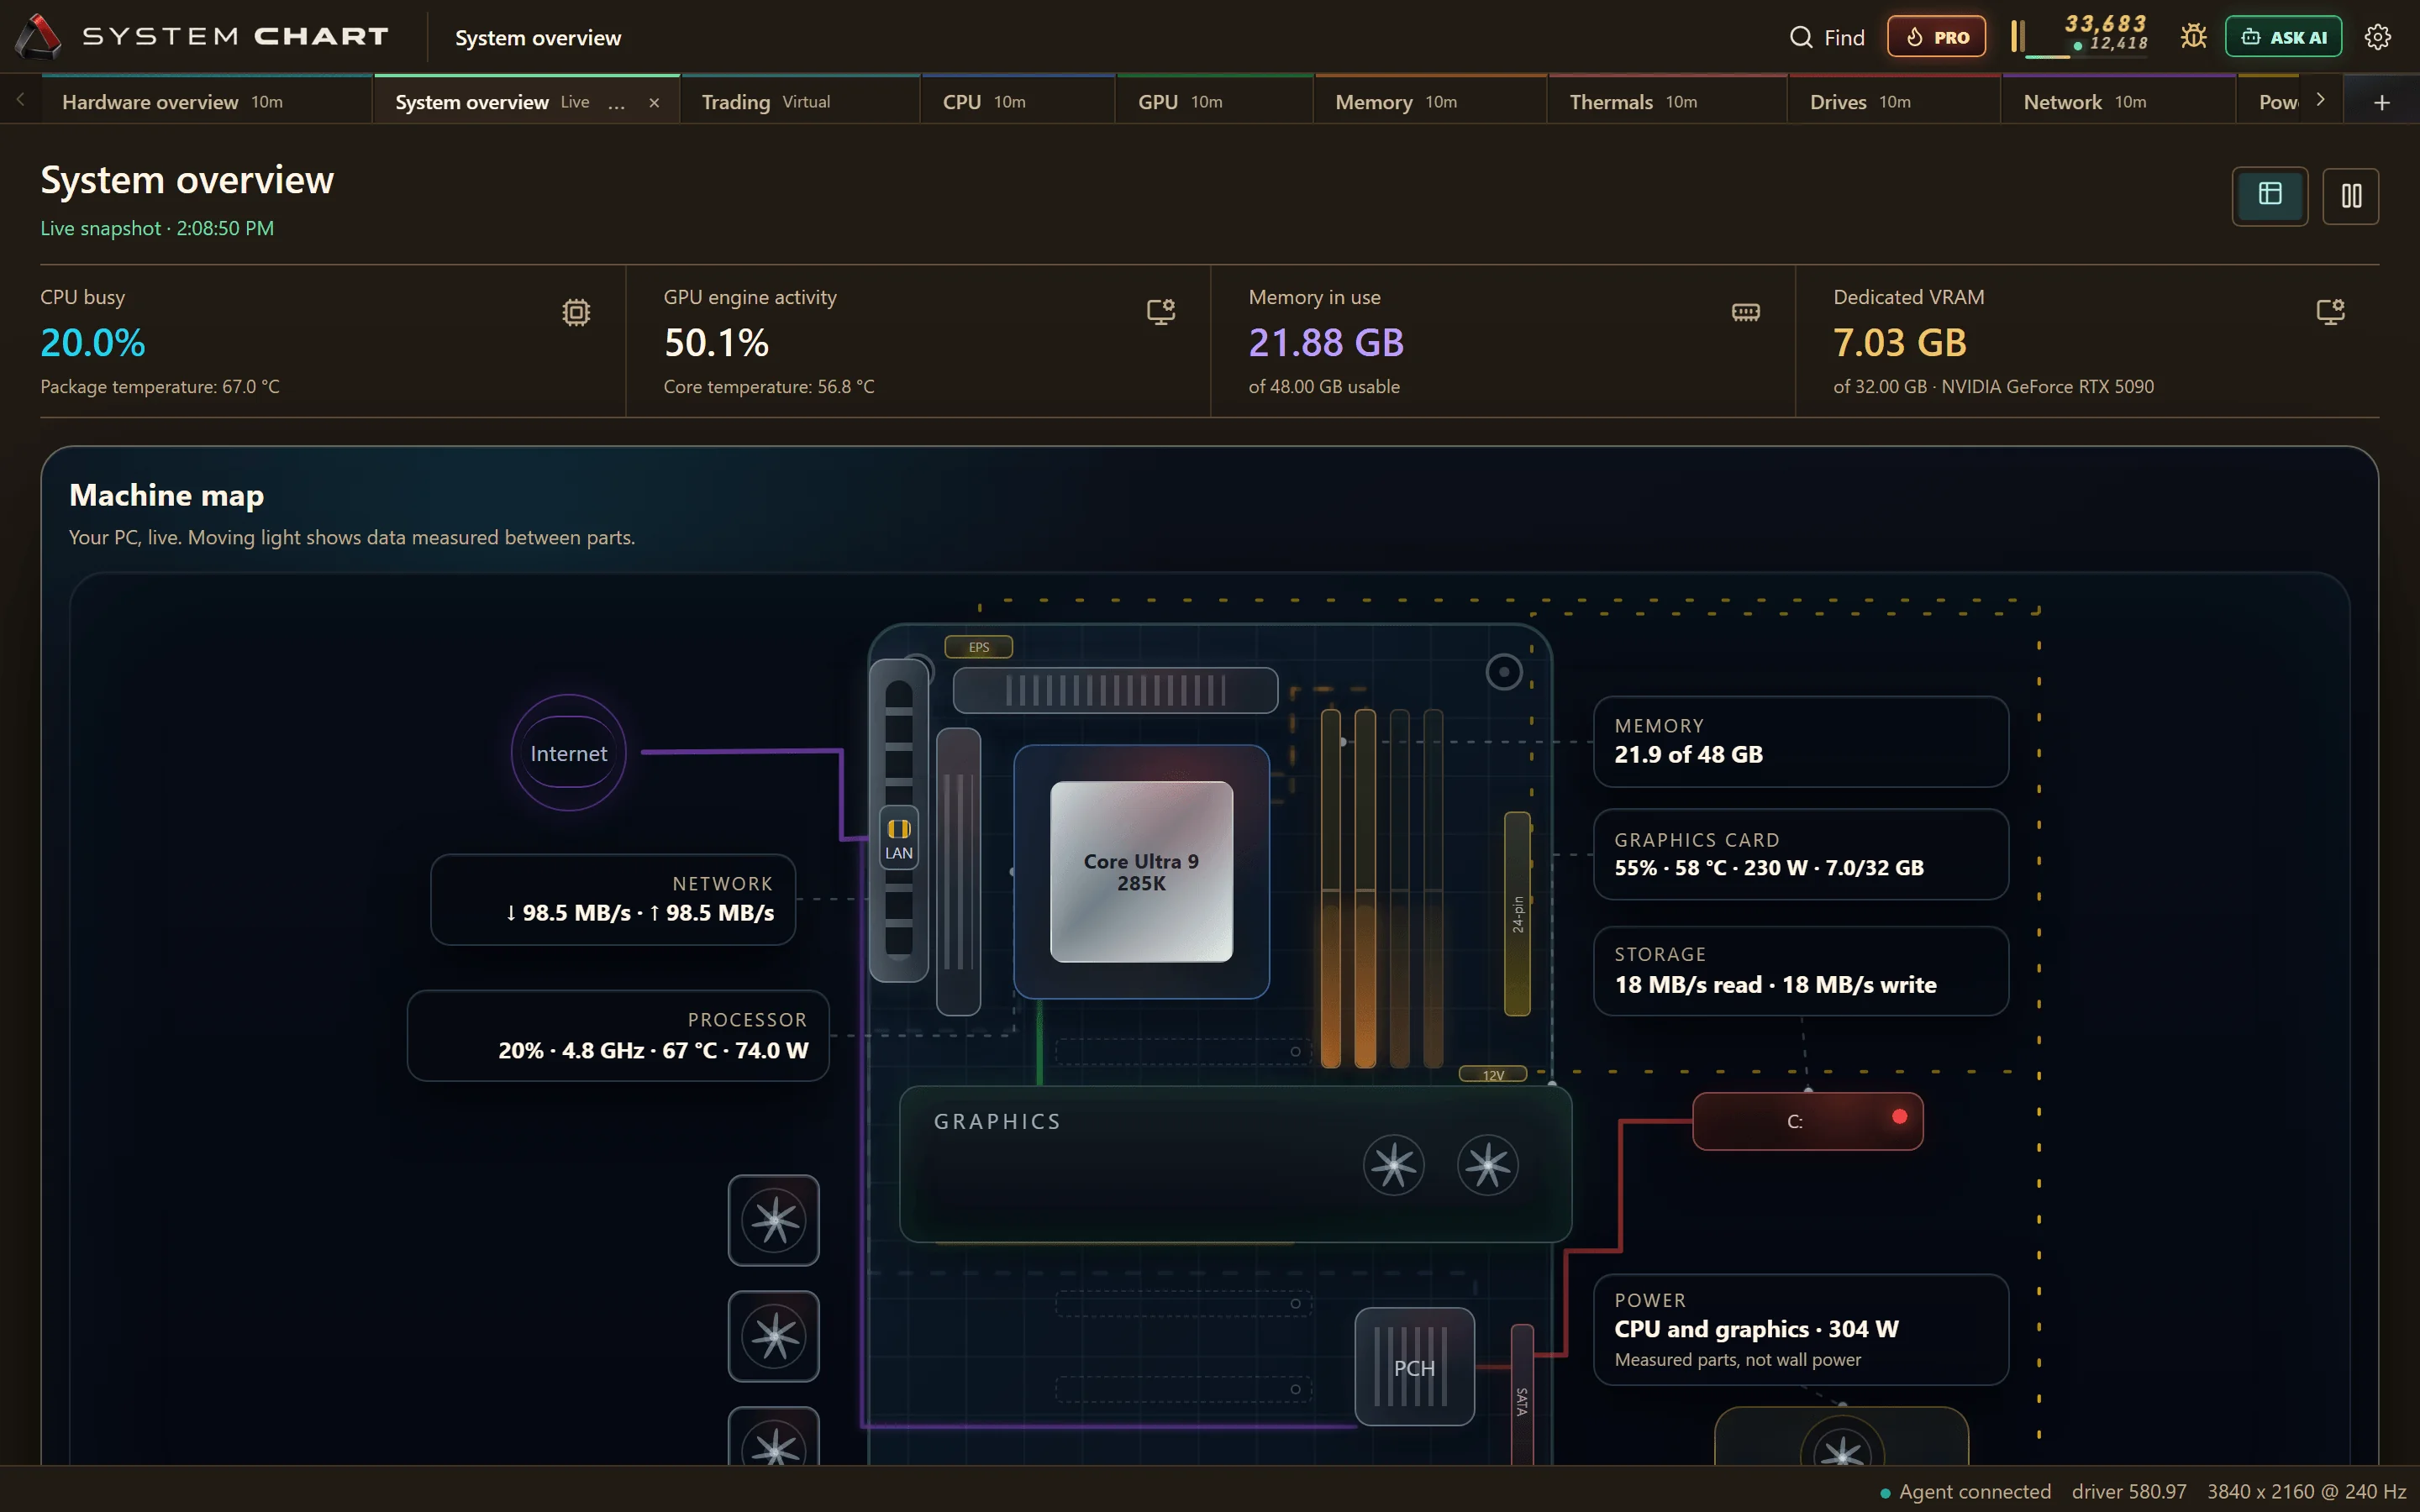
Fifty-two machine series, plus a set for every application and a set for every game. Graphics telemetry comes off the card where the card reports it. On cards that stay quiet it falls back to vendor neutral counters and leaves the rest blank instead of filling in a guess.
Processor 17
- load.avg / min / max
- freq.ghz
- cores.busy, cores.p, cores.e
- time.kernel, time.user
- time.dpc, time.interrupt
- ctxsw, queue, threads
Graphics 7
- load.avg
- temp.c
- power.w
- clock.core, clock.mem
- fan.pct
- vram.mb
Memory 8
- used.gb, commit.gb
- cache.gb
- faults, hardfaults
- pool.paged.gb
- pool.nonpaged.gb
Drives 6
- load.avg
- read.mbps, write.mbps
- latency.ms
- iops, queue
- free space per volume
Network 8
- rx.mbps, tx.mbps
- util.pct, link.mbps
- packets
- errors, discards
Power 6
- watts.cpu, watts.gpu
- watts.platform
- watts.psu
- load.avg at the wall
- cost at your tariff
Per application
- cpu.pct
- mem.mb
- io.mbps
- vram.mb
Per game
- fps.avg, fps.low
- frametime.ms
- frametime.worst
- gpu.busy
- stutter.pct
The assistant
Ask it what happened, in words.
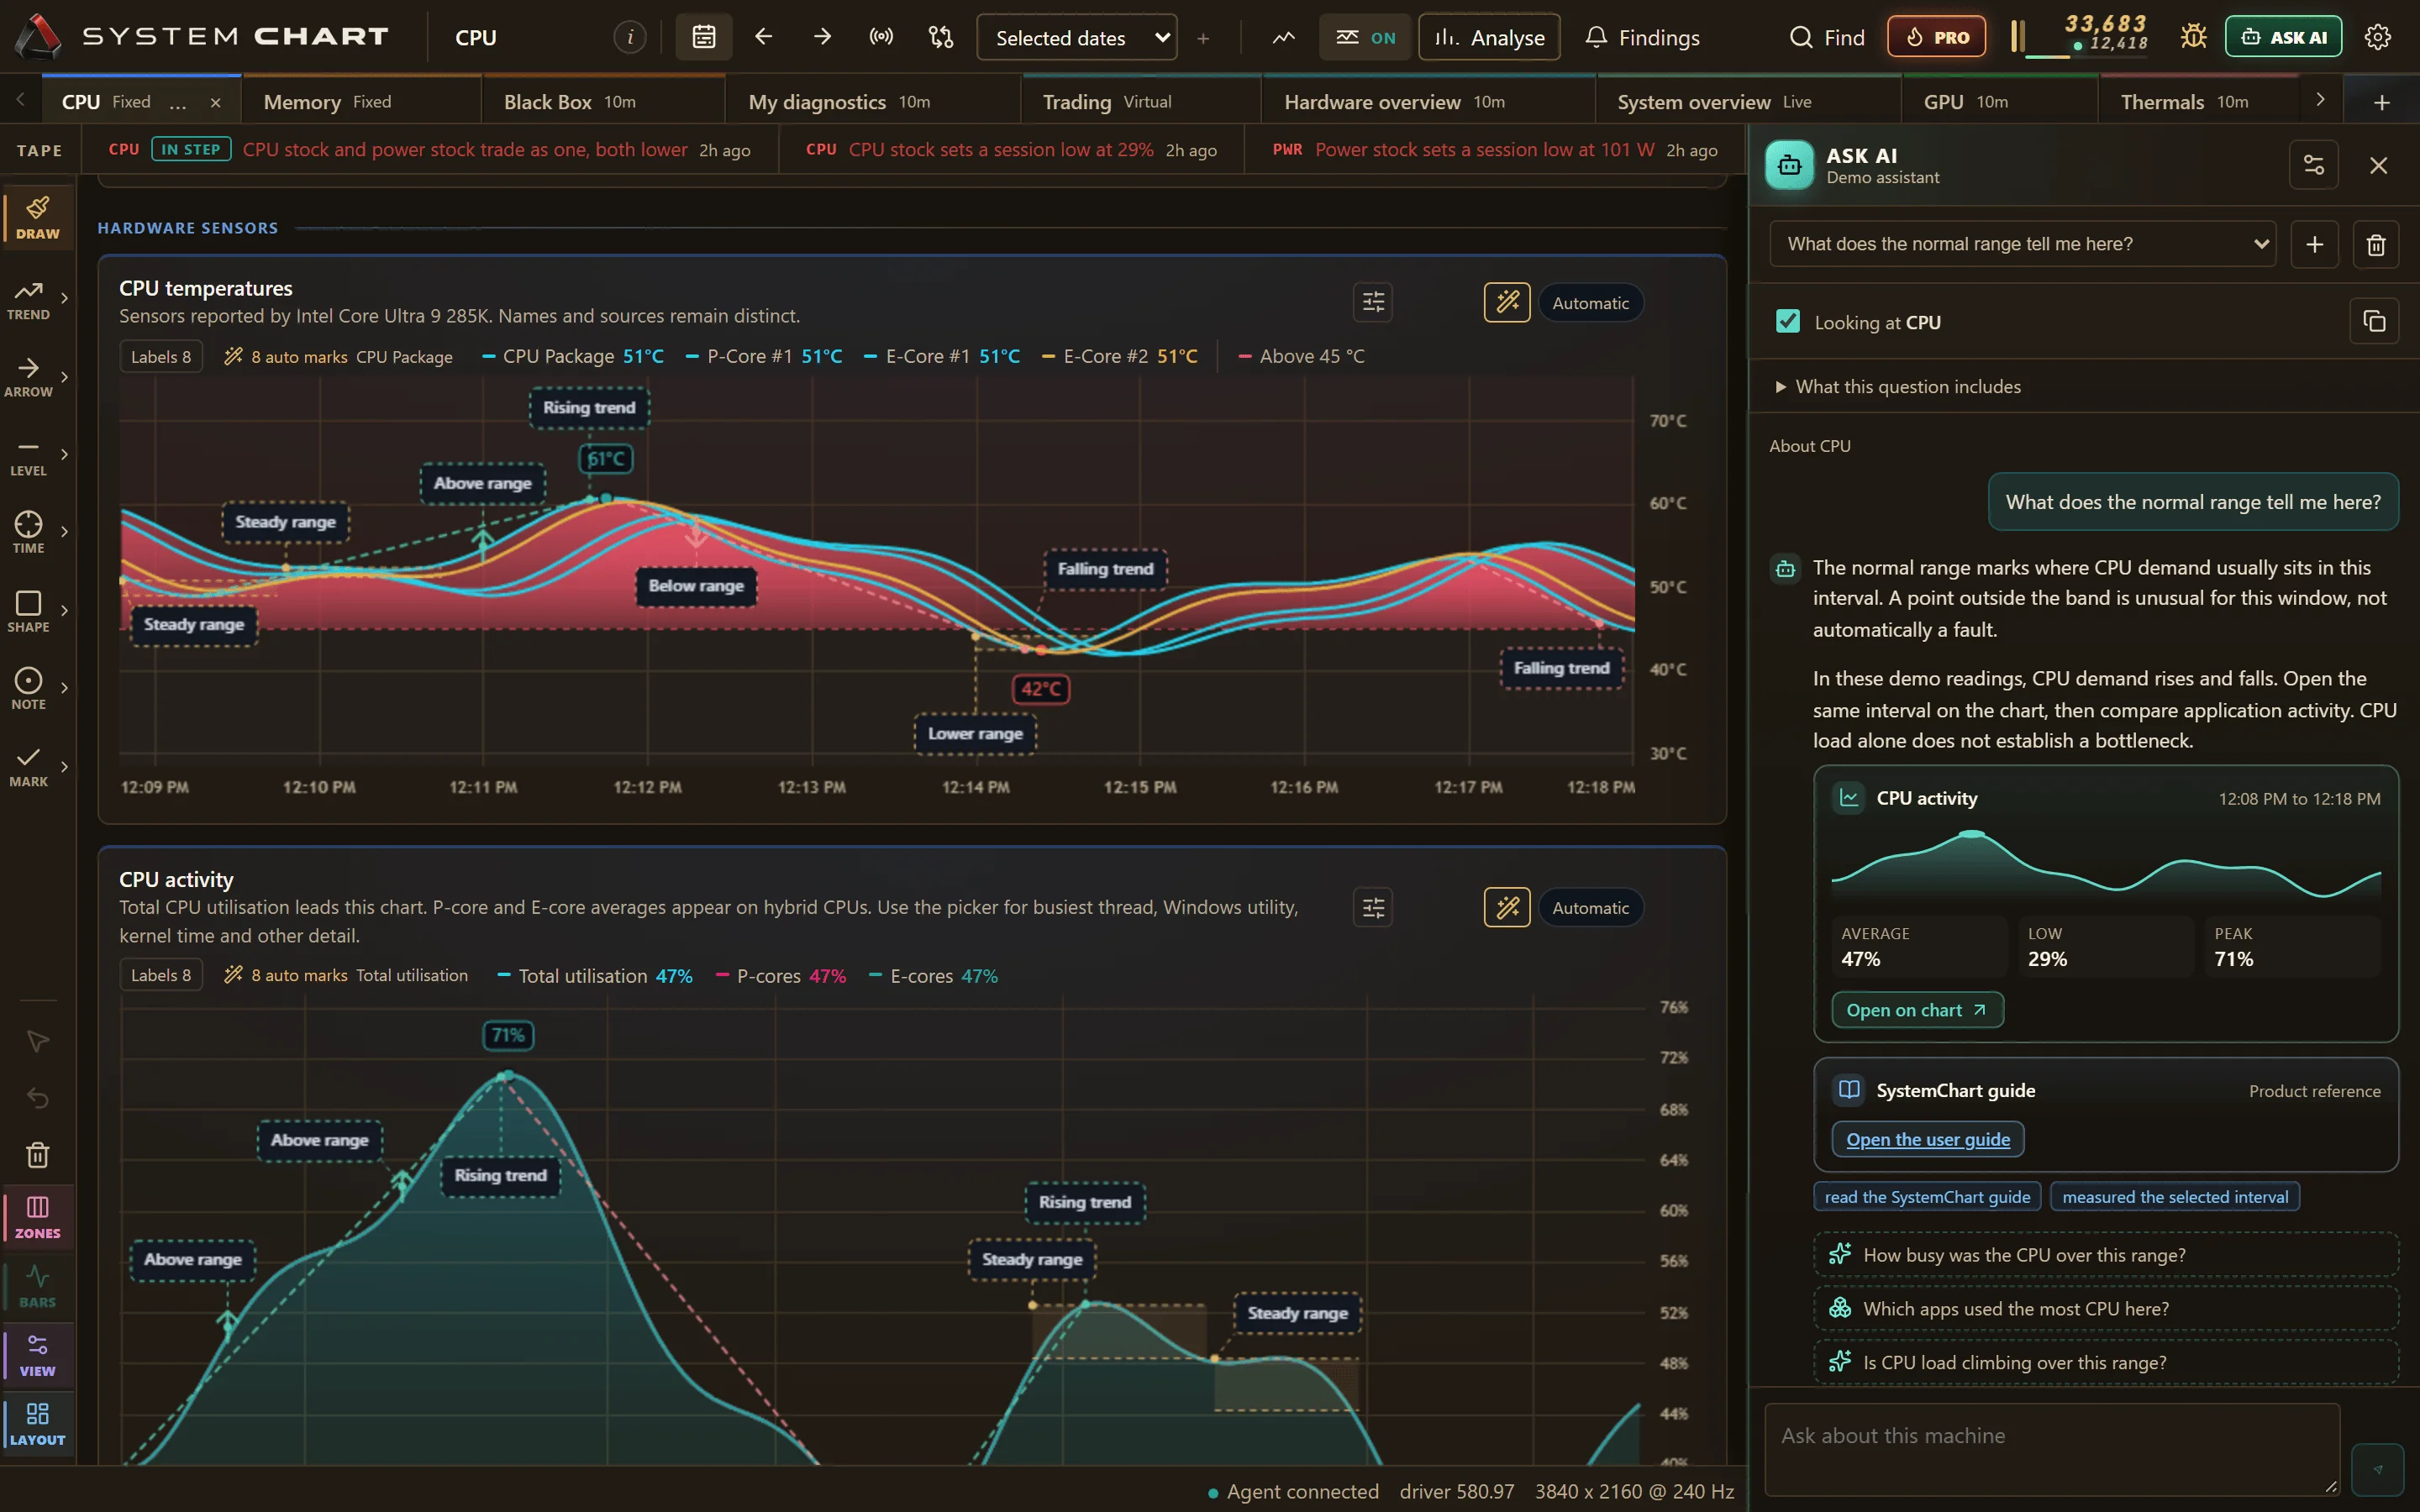
SystemChart answers questions about your machine through a model you choose and pay for. Your key, your account, your bill. It ships with no key of its own, which makes running a model on the same machine an ordinary option here instead of an advanced one.
Numbers in an answer come out of a tool that computed them against your recorded readings. Ask a model to read a telemetry database and reason about it and you get plausible figures. Give it no way to obtain a figure except by calling a function that measures one and you get real ones. Under each answer sits the list of tools it ran, so you can go and check.
It can also put what it is describing on screen. Ask for twenty minutes and you get twenty minutes, because the row of ranges holds round numbers and your question hardly ever is one.
Read-only tools
Summarise a window, measure how two readings move together and which one leads, fit a trend, find where something changed, break a resource down by application.
That change the view
Open a page, set the timeframe, add a study, turn markup on. None of them writes a reading, deletes anything, or touches capture, settings or licensing.
Providers by name
OpenAI, Azure AI Foundry, Ollama, LM Studio, Foundry Local, and anything else speaking the same shape. Windows encrypts your key and the window never sees it again.
Or bring your own assistant
SystemChart is also a Model Context Protocol server. Point Claude Desktop or VS Code at it and ask them about your machine instead.
Setting it up
One paste, and your assistant can read the machine.
Settings writes the configuration block for you with the real path already in it, for Claude Desktop or for VS Code, and copies it on one button. Between reading about this and using it sits a paste and a restart.
The tool server only reads. A confused model, or an instruction smuggled into a window title, gets you a wrong answer and no wrong actions.
While you play
A frame counter that is not an injected hook.
The counter is its own click-through window sitting above the game. Nothing gets written into the game process, so anti-cheat has nothing to object to and antivirus has nothing to quarantine.
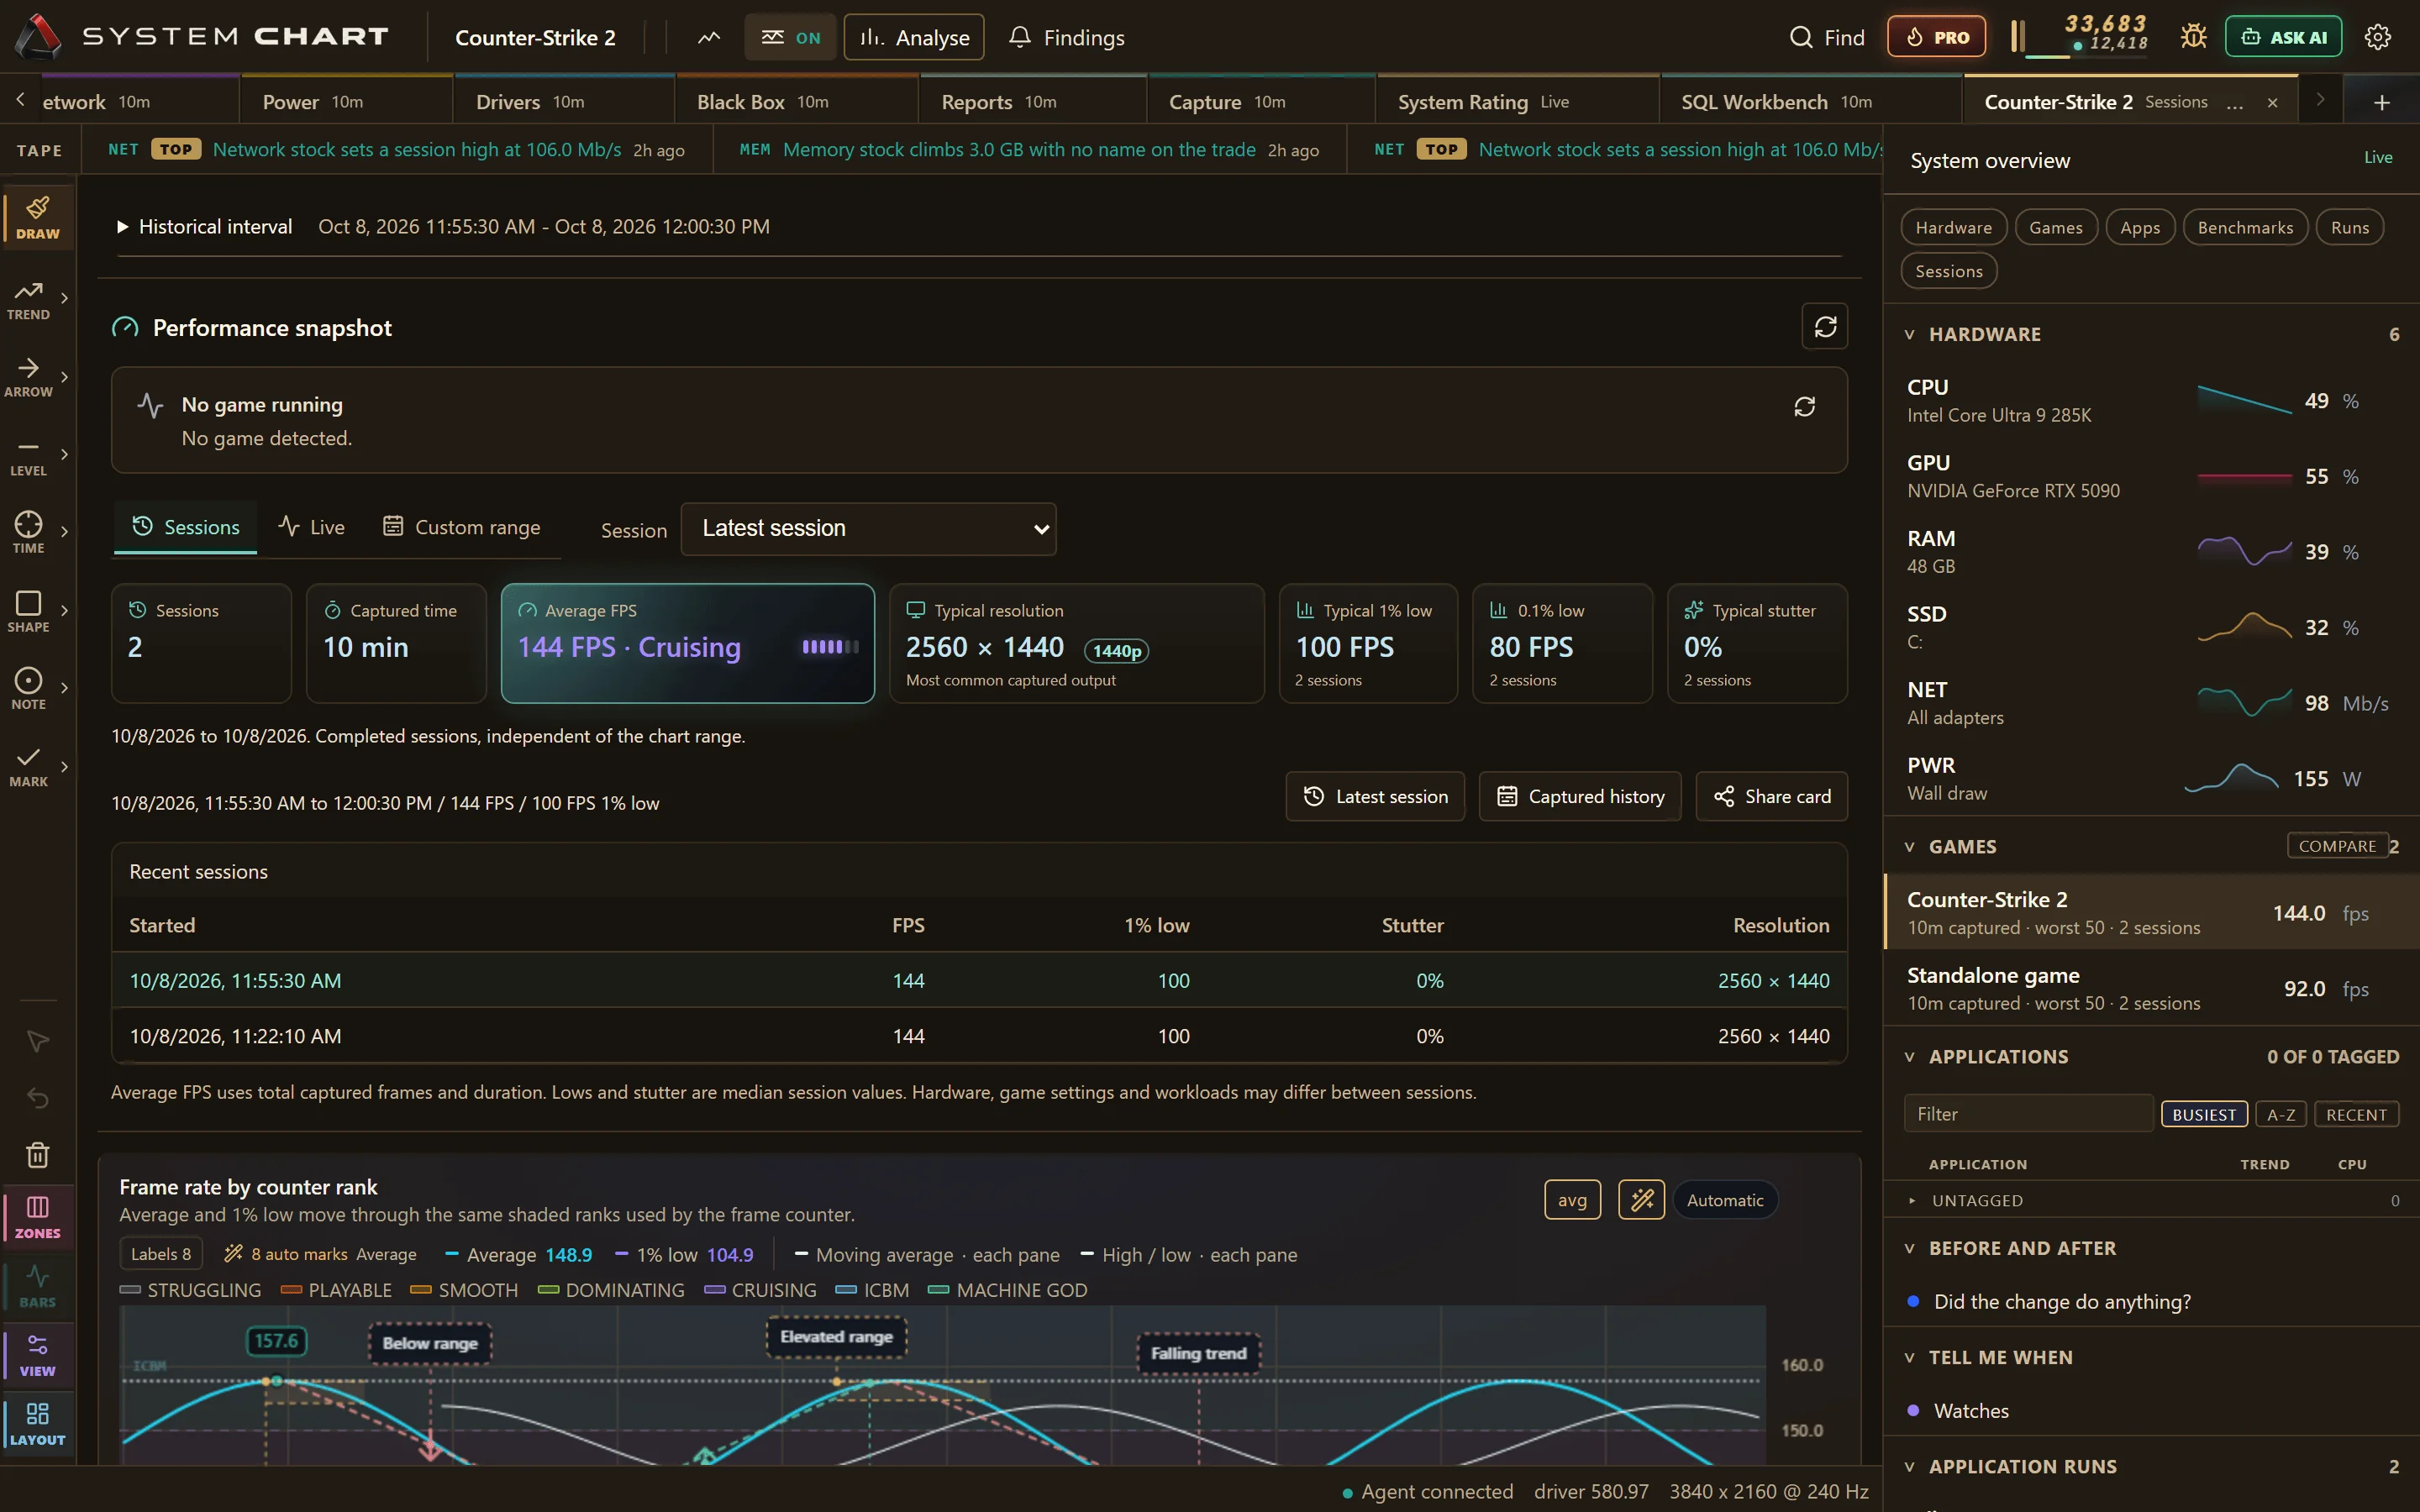
Ten fields to choose from, and a corner to put it in. Frame times get captured whether the counter is showing or not, so every session leaves behind a page with its lows, its worst frames, and how it stacks up against the last time you played.
Editions
Free is the whole product. Pro is the workshop.
Every reading, every page, every automatic explanation and all of your history are free and stay that way. Pro buys the tools for building your own views and arguing your own case with them. Nothing you captured is ever locked away, and a page somebody built in Pro still reads without it.
| Surface | Free | Pro adds |
|---|---|---|
| Capture | Every series, full resolution, every storage budget, autostart, pause and resume | Nothing. Capture is never gated. |
| Pages | Overview, Capture, CPU, GPU, Memory, Drives, Network, Power, Machine | Pin and rename tabs, editable copies, blank pages, the chart palette, saved layouts |
| Applications and games | Attribution, tags, category pages, game and session pages, peer comparison | Nothing |
| Analysis | All timeframes, automatic markup, operating zones, findings, trends, what changed | Manual indicators, drawing tools, custom limits, Compare, before and after, repeated experiments |
| Frame counter | On or off, with the default counter | Corner, fields, size and plate |
| Appearance | The Redline mark | Seven finishes for the window, taskbar and tray |
| Assistant | All of it. Bring your own model. | Nothing |
Not out yet
It arrives on Steam.
Every screenshot on this page came off a build that has been recording this machine for weeks. What is left has nothing to do with the software. The store page is in review, and it goes up the day that comes back approved.
Steam handles the install, the updates and the community. The free edition is the whole product and not a trial. Pro is a one-off purchase for people who want to build their own views.
Community
Questions and bug reports go through Steam.
Discussions
The Steam community hub is where questions, odd hardware and what people find in their own captures will live. It opens with the store page.
Bug reports
The application builds a diagnostic report and uploads it once you agree. Logs and machine capabilities go in. Your readings never do.
Hardware coverage
Graphics telemetry is fullest on cards that report it. Everything else works on any machine that runs Windows.